Punxsutawney Phil has spoken, and apparently his shadow isn't just calling for six more weeks of winter — it's also taking a swipe at investor morale. With much of the country already stuck in the icy grip of a stubborn polar vortex, patience is running thin, tempers are shorter than daylight hours, and the idea of even more winter feels like the last straw. In our entirely unscientific and wildly unofficial theory, traders glanced outside, saw the frost on their windshields, heard the groundhog's verdict, and decided that if spring isn't coming soon, optimism probably isn't either. Of course, this is all just for fun — Phil isn't setting interest rates or trading tech stocks — so now that we've had our laugh, let's turn to what's actually moving the Nasdaq and why it matters.
The Nasdaq opened the day on uneasy footing, slipping alongside other major U.S. stock futures as weakness in big technology names set the tone. Investors are growing cautious, bracing for a mix of high-profile earnings reports and looming macroeconomic signals. Adding to the tension, sell-offs in precious metals and other risk assets have rippled through markets, stoking volatility in tech shares. Questions around the durability of heavy AI infrastructure spending — coupled with uncertainty over future Federal Reserve leadership — are weighing on sentiment just as confidence had begun to look fragile.
Earnings season has only sharpened that scrutiny. Recent results from Microsoft, Meta, Apple, and Tesla showed that even substantial numbers no longer guarantee a rally, as investors dig deeper into long-term guidance and execution rather than headline beats. Valuations, particularly for AI-linked companies, are being reassessed with a colder eye, and some software and cloud stocks have slid despite solid reports. With prominent names like Alphabet, Amazon, and AMD still to come, and fresh economic data on the horizon, the market is entering a week where expectations — not excitement — are likely to drive the next move.
Technical Picture
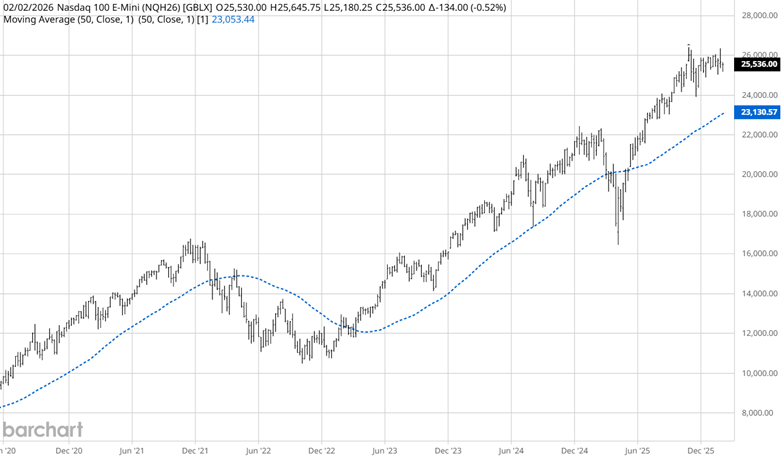
Source: Barchart
And the Nasdaq bull market trend continues. But, like any long-distance runner, it will need to pace itself (sideways or lower correction) to have the stamina to continue the race competitively (uptrend). The 50-week moving average continues to slope up since the recent significant pullback in April 2025. Like most markets that get far from their means, the Nasdaq is pausing the upward momentum. Eventually, human nature will prevail, and the need to buy or sell excessively will begin. As the market goes sideways, the moving average will have time to catch up with runaway prices. Possibly acting as a springboard for higher prices. I don't predict prices, but trade with the trend. And in experience, when the trend is up, you look for buying opportunities, not selling. From a risk standpoint, we are at lofty levels. But looking at the weekly chart, every past high that appeared lofty has been broken. Hence, being bearish in an uptrend is ego-driven, whereas being bullish is rational. Even being bullish requires risk management. Always have a "where am I wrong?" price and respect it "BEFORE" you get in the trade.
Correlated Years
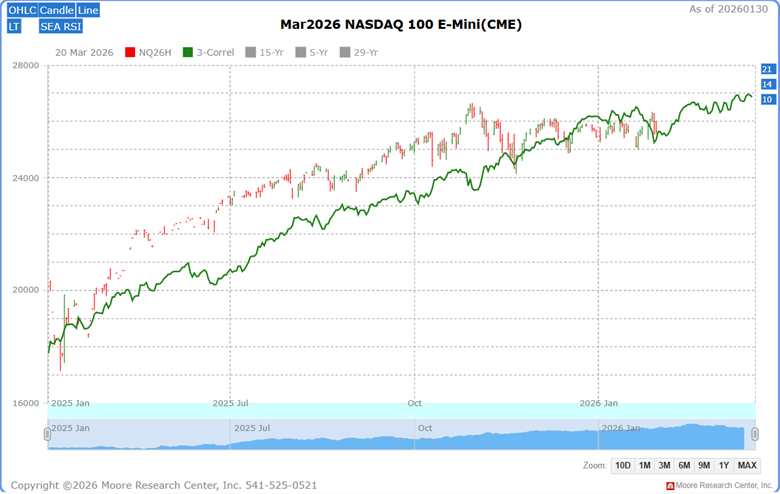
Source: Moore Research Center, Inc. (MRCI)
Currently, the March Nasdaq futures are correlated (green line) with 3-year patterns at greater than 84%. The years are: 2010 (90%), 2014 (87%), and 2021 (92%). And the "Almost made it years" are 1997 (83%), 2018 (81%), and 2022 (80%).
In the past few years mentioned, January saw some sideways trading, then a significant move up as February began. Combining this pattern with an upcoming 15-year seasonal buying pattern may give a trader's current strategy an edge.
Seasonal Pattern
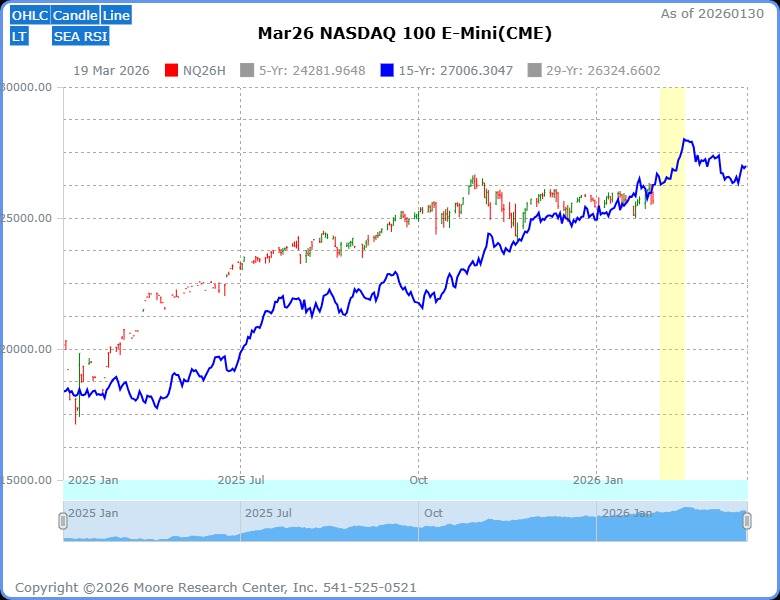
Source: MRCI
The 15-year seasonal pattern (blue line) for the Nasdaq market shows a persistent uptrend over that time. However, that information alone needs to be refined or enhanced to give trading an edge. MRCI does this by using extensive computer research to hone in on optimal seasonal windows (yellow window). During these periods, MRCI seeks not only to identify historical profitable patterns but also to minimize drawdown during the optimized periods.
The upcoming seasonal optimal window runs from approximately Feburary 03 to February 15. During this period of hypothetical testing over the past 15 years, MRCI has found that the March Nasdaq futures have closed higher on February 15 than on February 03 for14 of those years, a 93% occurrence.
As a crucial reminder, while seasonal patterns can provide valuable insights, they should not be the basis for trading decisions. Traders must consider various technical and fundamental indicators, risk management strategies, and market conditions to make informed, balanced trading decisions.
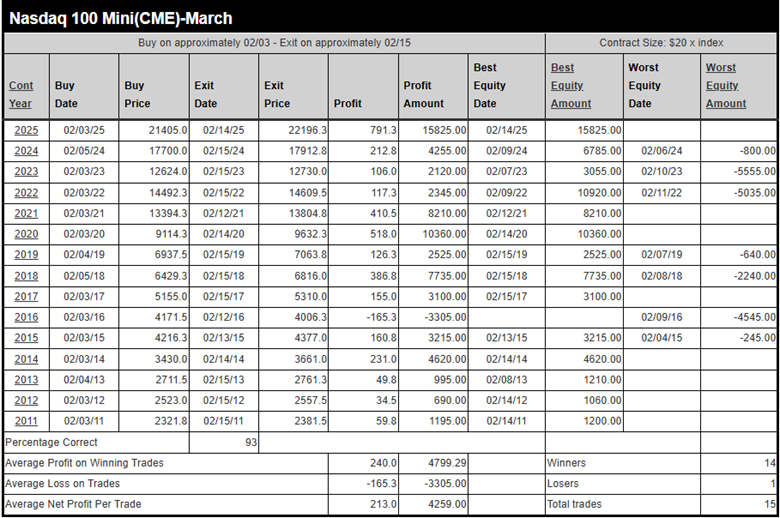
Source: MRCI
The fantastic part of this seasonal pattern is the number of years in which it did not have a daily closing drawdown. For 8 of the 15 years tested, 53% of the time, the Nasdaq did not have a daily closing drawdown. Meaning the market did not close under the February 03 settlement price for the duration of the seasonal window. During the testing period, the average net profit was 213.0 points, or $4,259 per a Nasdaq E-Mini contract.
Assets to Trade the Nasdaq Market
- Standard Size Futures: Nasdaq-100 futures (NQ), traded on CME, contract size $20 x Nasdaq-100 Index.
- Micro Size Futures: Micro E-mini Nasdaq-100 futures (NM), traded on CME, contract size $2 x Nasdaq-100 Index.
- ETFs: Invesco QQQ Trust (QQQ), tracks the Nasdaq-100 Index; leveraged ETFs like ProShares UltraPro QQQ (TQQQ).
- Options: Options on Nasdaq-100 futures (NQ), Micro E-mini Nasdaq-100 futures (NM), or ETFs like QQQ.
- Individual Stocks (Closely Correlated): Stocks like Apple (AAPL), Microsoft (MSFT), Amazon (AMZN), Nvidia (NVDA), and Meta (META), which are heavily weighted in the Nasdaq-100 (combined weight approximately~40%)
The major stock indexes—Nasdaq-100, S&P 500, Dow Jones Industrial Average, and Russell 2000—exhibit high correlation, with historical daily correlations between Nasdaq-100 and S&P 500 averaging 0.90-0.95 over the past decade. This tight relationship means the Nasdaq's upcoming seasonal upward bias in the 4th quarter will likely influence these other indexes to varying degrees, depending on sector differences. Traders should expect coordinated moves across these markets, with potential choppiness from possible year-end headwinds for the Nasdaq.
Other Stock Indexes:
In Closing…
As the Groundhog Day humor fades and the charts come back into focus, the bigger picture for the Nasdaq is one of caution layered atop opportunity. Investor sentiment may feel chilly, pressured by uneven tech earnings, macro uncertainty, and questions around AI spending, but the broader trend remains intact. The Nasdaq is still in a long-term uptrend, simply pausing to catch its breath after running far ahead of its averages. History, correlations, and well-defined seasonal patterns all suggest the market is entering a vital window where disciplined optimism — not blind enthusiasm — tends to be rewarded. That doesn't remove risk, and it certainly doesn't guarantee outcomes, but it does reinforce a timeless lesson: trade with the trend, respect your risk, and let data, not emotion or even a groundhog's shadow, guide your decisions.
On the date of publication, Don Dawson did not have (either directly or indirectly) positions in any of the securities mentioned in this article. All information and data in this article is solely for informational purposes. For more information please view the Barchart Disclosure Policy here.
More news from Barchart
- Dear Reddit Stock Fans, Mark Your Calendars for February 5
- Michael Saylor's Strategy Is Now Underwater on Bitcoin. Is The Dam Breaking Open?
- AMD’s Q4 Earnings Are Set To Impress: Should You Buy, Sell, Or Hold?
- ‘Solar Is Everything’: Tesla’s Elon Musk Says Other Energy Sources Are a Waste of Time, Like ‘a Caveman Throwing Some Twigs Into the Fire’