Valued at a market cap of $62.5 billion, Fortinet, Inc. (FTNT) provides cybersecurity solutions. The Sunnyvale, California-based company develops a comprehensive, AI-driven portfolio, anchored by its FortiGate firewalls and Security Fabric platform, that integrates network security, cloud security, secure access (SASE), and operational technology (OT) security.
Companies valued at $10 billion or more are typically classified as “large-cap stocks,” and Fortinet fits the label perfectly, with its market cap exceeding this threshold, underscoring its size, influence, and dominance within the software - infrastructure industry. The company's primary competitive advantage lies in its Security Fabric, a converged platform that integrates networking and security into a single, high-performance architecture powered by proprietary ASIC hardware.
This cybersecurity company has dipped 23.5% from its 52-week high of $109.33, reached on May 5, 2025. Shares of FTNT have declined 3.7% over the past three months, outperforming the State Street Technology Select Sector SPDR ETF’s (XLK) 6.4% drop during the same time frame.
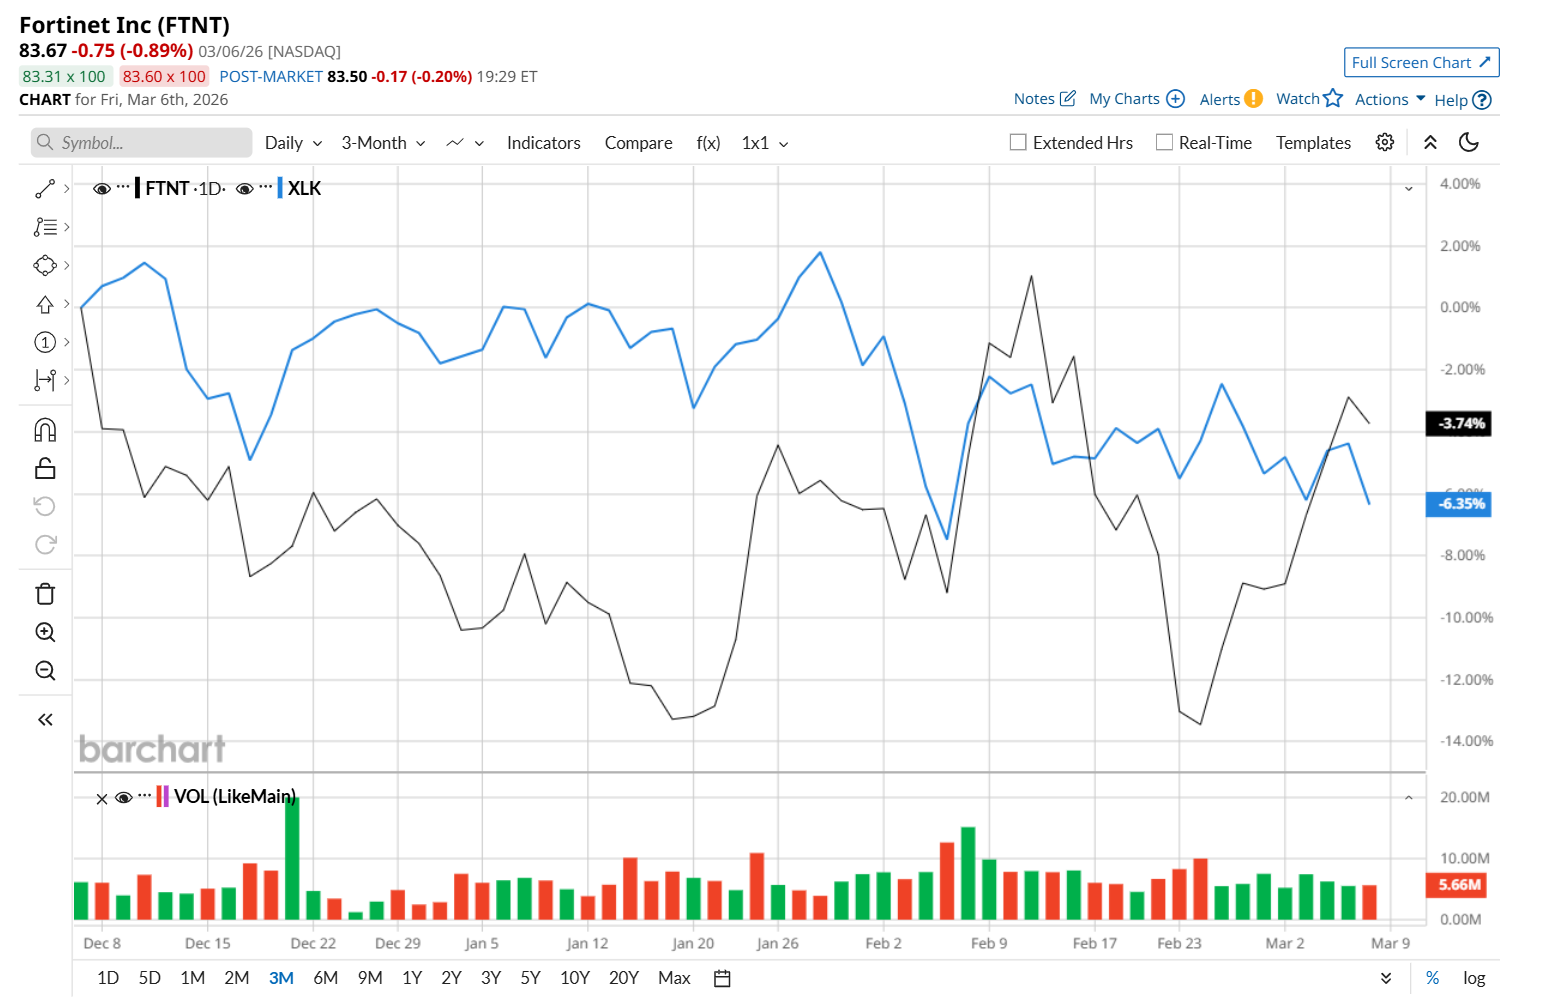
Moreover, on a YTD basis, shares of FTNT are up 5.4%, compared to XLK’s 4.6% loss. However, in the longer term, FTNT has decreased 17.7% over the past 52 weeks, considerably trailing behind XLK’s 27.5% uptick over the same time frame.
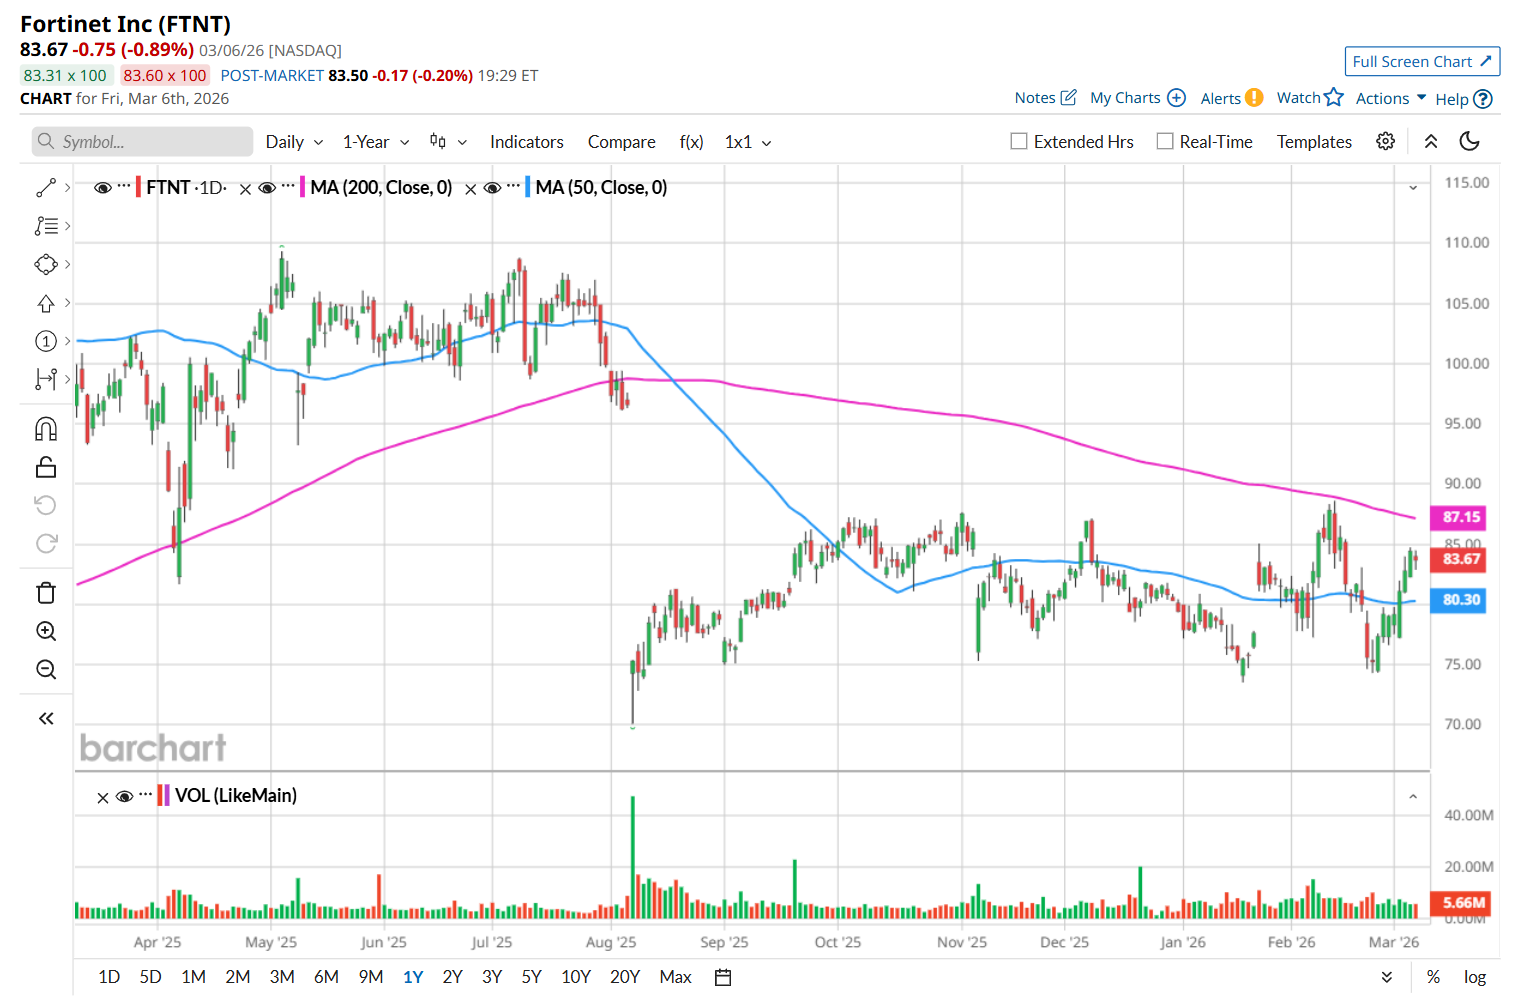
To confirm its recent bullish trend, FTNT has been trading above its 50-day moving average since early March. However, it has remained below its 200-day moving average since late July.
Fortinet’s stock declined sharply in mid-2025 due to concerns about slowing growth. However, several factors suggest the stock could rebound in 2026, including strong results, analyst sentiment, and institutional activity. In Q4, Fortinet reported solid performance, with revenue rising 15.1% year-over-year to $1.9 billion, beating consensus estimates. Growth was driven by an increase in product and services revenue and a rise in billings, with strength seen across its portfolio and expected to continue into the coming year. Although analyst reactions to the results and guidance were mixed, more price target increases than decreases were issued, indicating an overall bullish bias.
FTNT has underperformed its rival, Palo Alto Networks, Inc. (PANW), which declined 8% over the past 52 weeks. However, it has outpaced PANW’s 10.4% YTD drop.
Despite FTNT’s recent outperformance, analysts remain cautious about its prospects. The stock has a consensus rating of "Hold” from the 43 analysts covering it, and the mean price target of $88.59 suggests a 5.9% premium to its current price levels.
On the date of publication, Neharika Jain did not have (either directly or indirectly) positions in any of the securities mentioned in this article. All information and data in this article is solely for informational purposes. For more information please view the Barchart Disclosure Policy here.
More news from Barchart
- The $200 Billion Question: Is Amazon Finally Ready to Pay a Dividend?
- This Penny Stock Is Soaring on a New Drone Contract Win. Should You Buy Peraso Here Amid U.S.-Iran War?
- A $100 Billion and More Reasons to Buy Broadcom Stock Now
- As Marvell Breaks Through Key Resistance Levels, Should You Chase the Rally in MRVL Stock?