
All financial figures are in Canadian dollars unless otherwise noted. This news release refers to certain financial measures and ratios that are not specified, defined or determined in accordance with Generally Accepted Accounting Principles ("GAAP"), including net revenue; adjusted earnings before interest, taxes, depreciation and amortization ("adjusted EBITDA"); adjusted cash flow from operating activities; adjusted cash flow from operating activities per common share; and proportionately consolidated debt-to-adjusted EBITDA. For more information see "Non-GAAP and Other Financial Measures" herein.
Pembina Pipeline Corporation ("Pembina" or the "Company") (TSX: PPL; NYSE: PBA) announced today its financial and operating results for the third quarter of 2023.
This press release features multimedia. View the full release here: https://www.businesswire.com/news/home/20231102235590/en/
Adjusted EBITDA (Graphic: Business Wire)
Highlights
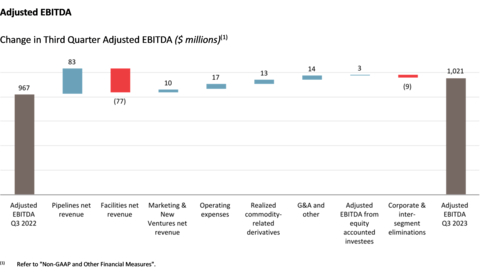
- Third Quarter Results - reported earnings of $346 million and record quarterly adjusted EBITDA of $1,021 million. Third quarter results reflect growing volumes, including record quarterly conventional pipelines volumes, rising utilization on other key systems, and a strong contribution from Pembina's marketing business.
- Guidance Raised - 2023 adjusted EBITDA guidance range has increased to $3.75 billion to $3.85 billion (previously $3.55 billion to $3.75 billion).
- Commercial Successes - extended or signed new long-term contracts totaling 50,000 barrels per day ("bpd") on key assets in both Pipelines and Facilities.
- Phase VIII Peace Pipeline Expansion - the estimated project cost has been reduced to $475 million (previously $530 million) and remains on schedule.
- Common Share Dividend - the board of directors declared a common share cash dividend for the fourth quarter of 2023 of $0.6675 per share, to be paid, subject to applicable law, on December 29, 2023, to shareholders of record on December 15, 2023.
- Strong Balance Sheet - at September 30, 2023, the ratio of proportionately consolidated debt-to-adjusted EBITDA was 3.4 times.
Financial and Operational Overview
|
3 Months Ended September 30 |
9 Months Ended September 30 |
||
($ millions, except where noted) |
2023 |
2022 |
2023 |
2022 |
Revenue |
2,292 |
2,779 |
6,659 |
8,912 |
Net revenue(1) |
1,073 |
1,030 |
2,877 |
3,204 |
Gross profit |
659 |
874 |
1,990 |
2,442 |
Adjusted EBITDA(1) |
1,021 |
967 |
2,791 |
2,821 |
Earnings |
346 |
1,829 |
1,078 |
2,728 |
Earnings per common share – basic (dollars) |
0.58 |
3.24 |
1.79 |
4.75 |
Earnings per common share – diluted (dollars) |
0.57 |
3.23 |
1.78 |
4.73 |
Cash flow from operating activities |
644 |
723 |
1,755 |
1,982 |
Cash flow from operating activities per common share – basic (dollars) |
1.17 |
1.30 |
3.19 |
3.58 |
Adjusted cash flow from operating activities(1) |
659 |
588 |
1,899 |
1,971 |
Adjusted cash flow from operating activities per common share – basic (dollars)(1) |
1.20 |
1.07 |
3.45 |
3.57 |
Capital expenditures |
169 |
131 |
429 |
462 |
Total volumes (mboe/d)(2) |
3,398 |
3,424 |
3,257 |
3,379 |
(1) |
Refer to "Non-GAAP and Other Financial Measures". |
(2) |
Total revenue volumes. Revenue volumes are physical volumes plus volumes recognized from take-or-pay commitments. Volumes are stated in thousand barrels of oil equivalent per day ("mboe/d"), with natural gas volumes converted to mboe/d from millions of cubic feet per day ("MMcf/d") at a 6:1 ratio, and also include revenue volumes from Pembina's equity accounted investees. |
Financial and Operational Overview by Division
|
3 Months Ended September 30 |
9 Months Ended September 30 |
||||||||||
|
2023 |
2022 |
2023 |
2022 |
||||||||
($ millions, except where noted) |
Volumes(1) |
Reportable Segment Earnings (Loss) Before Tax |
Adjusted EBITDA(2) |
Volumes(1) |
Reportable Segment Earnings (Loss) Before Tax |
Adjusted EBITDA(2) |
Volumes(1) |
Reportable Segment Earnings (Loss) Before Tax |
Adjusted EBITDA(2) |
Volumes(1) |
Reportable Segment Earnings (Loss) Before Tax |
Adjusted EBITDA(2) |
Pipelines |
2,595 |
437 |
591 |
2,531 |
377 |
535 |
2,500 |
1,163 |
1,617 |
2,500 |
1,120 |
1,579 |
Facilities |
803 |
179 |
319 |
893 |
1,273 |
291 |
757 |
467 |
889 |
879 |
1,670 |
849 |
Marketing & New Ventures |
— |
(4) |
159 |
— |
249 |
180 |
— |
231 |
424 |
— |
601 |
550 |
Corporate |
— |
(170) |
(48) |
— |
(158) |
(39) |
— |
(487) |
(139) |
— |
(502) |
(157) |
Total |
3,398 |
442 |
1,021 |
3,424 |
1,741 |
967 |
3,257 |
1,374 |
2,791 |
3,379 |
2,889 |
2,821 |
(1) |
Volumes for Pipelines and Facilities divisions are revenue volumes, which are physical volumes plus volumes recognized from take-or-pay commitments. Volumes are stated in mboe/d, with natural gas volumes converted to mboe/d from MMcf/d at a 6:1 ratio. Volumes do not include Empress processing capacity. Marketed natural gas liquids ("NGL") volumes are excluded from volumes to avoid double counting. Refer to "Marketing & New Ventures Division" in Pembina's Management's Discussion and Analysis dated November 2, 2023 for the three and nine months ended September 30, 2023 for further information. |
(2) |
Refer to "Non-GAAP and Other Financial Measures". |
For further details on the Company's significant assets, including definitions for capitalized terms used herein that are not otherwise defined, refer to Pembina's Annual Information Form for the year ended December 31, 2022 filed at www.sedarplus.ca (filed with the U.S. Securities and Exchange Commission at www.sec.gov under Form 40-F) and on Pembina's website at www.pembina.com. |
|
Financial & Operational Highlights
Adjusted EBITDA
Pembina reported third quarter adjusted EBITDA of $1,021 million, representing a $54 million or six percent increase over the same period in the prior year.
Third quarter results reflect strong performance in the Pipelines and Facilities divisions as Pembina continues to benefit from growing volumes and higher tolls on certain systems. Notably, the conventional pipelines business delivered record quarterly volumes. Further, Pembina's marketing business delivered another solid contribution.
Pipelines reported adjusted EBITDA of $591 million for the third quarter, representing a $56 million or ten percent increase compared to the same period in the prior year, reflecting the net impact of the following factors:
- higher volumes on certain Pipelines assets;
- net loss allowance; and
- higher tolls, due to inflation, primarily on the Cochin Pipeline and Peace Pipeline system; offset by
- lower contribution from Alliance; and
- higher integrity spending and repairs and maintenance costs.
Facilities reported adjusted EBITDA of $319 million for the third quarter, representing a $28 million or ten percent increase over the same period in the prior year, reflecting the net impact of the following factors:
- the transfer of the majority of Pembina's wholly-owned field-based gas processing assets to Pembina Gas Infrastructure ("PGI") following the creation of PGI on August 15, 2022 (the "PGI Transaction"), with the contribution from such assets now being accounted for in share of profit from equity accounted investees;
- higher share of profit from equity accounted investees, primarily due to the PGI Transaction and the strong performance from the former Energy Transfer Canada ("ETC") plants and the Dawson Assets; and
- a gain resulting from a contract renewal of an asset now recognized as a finance lease.
Marketing & New Ventures reported adjusted EBITDA of $159 million for the third quarter, representing a $21 million or 12 percent decrease compared to the same period in the prior year, reflecting the net impact of the following factors:
- lower contribution from Aux Sable, as a result of lower NGL prices; and
- lower margins on natural gas and crude oil sales; offset by
- lower realized losses on commodity-related derivatives; and
- higher margins on NGL sales.
Corporate reported adjusted EBITDA of negative $48 million for the third quarter, representing an $9 million or 23 percent decrease over the same period in the prior year, reflecting the net impact of the following factors:
- higher labour costs, including primarily higher incentive costs; and
- higher information technology costs; offset by
- higher shared service revenue; and
- lower consulting costs.
Earnings
Pembina reported third quarter earnings of $346 million, representing a $1,483 million or 81 percent decrease over the same period in the prior year. The decrease was primarily due to the benefit in the prior year from a gain on the change in ownership of the majority of Pembina's field-based gas processing assets, which were wholly-owned prior to the creation of PGI on August 15, 2022.
Pipelines had reportable segment earnings before tax of $437 million, representing a $60 million or 16 percent increase compared to the same period in the prior year. In addition to the factors impacting adjusted EBITDA, as noted above, the third quarter was impacted by lower legal fees and higher depreciation.
Facilities had reportable segment earnings before tax of $179 million, representing a $1,094 million or 86 percent decrease over the same period in the prior year. In addition to the factors impacting adjusted EBITDA, as noted above, the third quarter variance is largely attributable to the gain on sale recognized on the PGI Transaction in the third quarter of 2022.
Marketing & New Ventures had reportable segment earnings before tax of negative $4 million, representing a $253 million decrease over the same period in the prior year. In addition to the items impacting adjusted EBITDA discussed above, the decrease was related to an unrealized loss on commodity-related derivatives in the quarter compared to an unrealized gain in the third quarter of 2022, an increase in provisions at Aux Sable, and lower other expenses and net finance costs.
In addition to the changes in reportable segment earnings for each division discussed above, the change in third quarter earnings compared to the prior period was due to higher income tax expense, due to the tax impact of the PGI Transaction recognized in the third quarter of 2022, and higher general and administrative costs.
Cash Flow From Operating Activities
Cash flow from operating activities of $644 million for the third quarter represents a $79 million or 11 percent decrease compared to the same period in the prior year. The decrease was primarily driven by a decrease in the change in non-cash working capital, partially offset by higher distributions from equity accounted investees and higher operating results.
On a per share (basic) basis, cash flow from operating activities was $1.17 per share, representing a decrease of ten percent compared to the same period in the prior year.
Adjusted Cash Flow From Operating Activities
Adjusted cash flow from operating activities of $659 million for the third quarter represents a $71 million or 12 percent increase compared to the same period in the prior year. The increase was largely due to the same items impacting cash flow from operating activities, discussed above, excluding the change in non-cash working capital, partially offset by higher current tax expense.
On a per share (basic) basis, adjusted cash flow from operating activities was $1.20 per share, representing an increase of 12 percent compared to the same period in the prior year.
Volumes
Total volumes of 3,398 mboe/d for the third quarter represent a decrease of approximately one percent over the same period in the prior year.
Pipelines volumes of 2,595 mboe/d in the third quarter represent a three percent increase compared to the same period in the prior year, primarily reflecting higher volumes on the Peace, Northern, and Drayton Valley pipelines.
Facilities volumes of 803 mboe/d in the third quarter represent a ten percent decrease compared to the same period in the prior year, reflecting the net impact of the following factors:
- the disposition of Pembina's interest in the assets comprising the Empress I Plant, Empress I Expansion Plant, and the Empress VI Plant (collectively, "E1 and E6") in the fourth quarter of 2022, in exchange for a processing agreement that provides Pembina the right to first priority for gas processing at all Plains Midstream-operated assets at Empress; and
- lower volumes at the Redwater Complex and at Younger due to planned outages in the third quarter of 2023; offset by
- increased gas processing volumes, primarily at the former ETC plants and the Dawson Assets.
Excluding the impact of the disposition of Pembina’s interest in the E1 and E6 assets at Empress, Facilities volumes would have increased by two percent compared to the same period in the prior year.
Marketed NGL volumes of 166 mboe/d in the third quarter represents a ten percent decrease compared to the same period in the prior year, reflecting reduced ethane and butane sales as a result of planned outages at the Redwater Complex in the third quarter of 2023.
Quarterly Common Share Dividend
Pembina's board of directors has declared a common share cash dividend for the fourth quarter of 2023 of $0.6675 per share, to be paid, subject to applicable law, on December 29, 2023, to shareholders of record on December 15, 2023. The common share dividends are designated as "eligible dividends" for Canadian income tax purposes. For non-resident shareholders, Pembina's common share dividends should be considered "qualified dividends" and may be subject to Canadian withholding tax.
For shareholders receiving their common share dividends in U.S. funds, the cash dividend is expected to be approximately U.S. $0.4811 per share (before deduction of any applicable Canadian withholding tax) based on a currency exchange rate of 0.7207. The actual U.S. dollar dividend will depend on the Canadian/U.S. dollar exchange rate on the payment date and will be subject to applicable withholding taxes.
Quarterly dividend payments are expected to be made on the last business day of March, June, September and December to shareholders of record on the 15th day of the corresponding month, if, as and when declared by the board of directors. Should the record date fall on a weekend or on a statutory holiday, the record date will be the next succeeding business day following the weekend or statutory holiday.
Executive Overview
Third quarter results, highlighted by record quarterly adjusted EBITDA, reflect the strength of Pembina's business, including growing volumes and rising utilization across many systems and a marketing business that continues to outperform the long-run average. Whereas first half results were impacted by wildfires and the Northern Pipeline outage, the third quarter more accurately reflects the underlying positive momentum in the Western Canadian Sedimentary Basin ("WCSB"). This is demonstrated most notably by the nearly six percent year-over-year increase in third quarter volumes in the conventional pipelines business.
Third quarter results are consistent with Pembina's broader outlook for the WCSB and the potential for significant growth driven by near term catalysts, including new egress from West Coast LNG projects and the Trans Mountain Pipeline expansion, as well as potential new developments in Alberta's petrochemical industry. Given the scope and reach of its assets, and existing long-term commercial agreements, Pembina is uniquely positioned to capture new volumes and benefit from this growth.
On the strength of the year-to-date results and outlook for the remainder of the year, Pembina has raised its 2023 adjusted EBITDA guidance range to $3.75 to $3.85 billion (previously $3.55 to $3.75 billion). Relative to Pembina's previous guidance, the revised outlook for 2023 primarily reflects stronger results in the NGL and crude oil marketing businesses, as well as a higher contribution from Pipelines.
Year-to-date, Pembina has paid down approximately $300 million of proportionately consolidated debt using proceeds from the sale of PGI's interest in the Key Access Pipeline System and cash flow from operating activities. Pembina also repurchased approximately 1.2 million common shares at a total cost of $50 million.
Full year 2023 cash flow from operating activities is expected to exceed dividend payments, capital expenditures, and the common share repurchases to date. Pembina will continue to evaluate the merits of debt repayment relative to additional share repurchases, taking into account prevailing market conditions and risk-adjusted returns, as well as the need to fund future capital projects.
At September 30, 2023, the ratio of proportionately consolidated debt-to-adjusted EBITDA was 3.4 times, supporting a strong BBB credit rating.
Pembina is pleased to provide the following additional commercial, operational and corporate updates:
- Signed new transportation agreements on the Peace Pipeline for approximately 25,000 bpd. The new contracts have a weighted average term of approximately five and a half years. Approximately one quarter of the incremental volumes are currently being serviced with the balance of the contracts taking effect in 2024 and 2025.
- At Pembina's Redwater Complex, an existing 25,000 bpd contract that was set to expire in 2027 has been extended through 2032, and Pembina continues to advance discussions with customers related to the ongoing contracting of the recently announced RFS IV expansion.
- On October 3, 2023, Pembina reactivated the approximately 100,000 bpd Nipisi Pipeline system to serve customers in the rapidly growing Clearwater oil play. As previously announced, the reactivation was supported by agreements for a significant long-term commitment with an anchor customer, which include the connection of the Nipisi Pipeline to terminalling infrastructure approximately 40 kilometers north of Slave Lake, Alberta. Given the outlook for continued growth in the Clearwater, discussions continue with several producers in the area regarding potential additional long-term contractual commitments.
- In 2021, Pembina formed Chinook Pathways, a partnership with Western Indigenous Pipeline Group that is comprised of Indigenous communities along the Trans Mountain pipeline route in Alberta and British Columbia. The Federal government recently initiated the first phase of the Trans Mountain divestment process focused on individual Indigenous community participation. Neither Chinook Pathways nor Pembina will be eligible to participate in the first phase. A subsequent phase for the sale of the remaining equity interest is still undefined. Based on public information, the earliest that a divestment of the asset could likely occur is the end of 2024. Based on public disclosure there appears to be outstanding regulatory, construction and tolling issues that pose further schedule, cost, and divestment timing uncertainty. Pembina, like any other potential commercial purchaser, requires the many outstanding issues related to the project to crystallize in order to prudently and appropriately assess the opportunity and determine next steps.
- Effective October 23, 2023, Robert Gwin resigned from Pembina’s Board of Directors, for personal reasons.
Projects and New Developments
Pipelines
- The Phase VIII Peace Pipeline expansion will enable segregated pipeline service for ethane-plus and propane-plus NGL mix from Gordondale, Alberta, which is centrally located within the Montney trend, into the Edmonton area for market delivery. The project includes new 10-inch and 16-inch pipelines, totaling approximately 150 kilometres, in the Gordondale to La Glace corridor of Alberta, as well as new mid-point pump stations and terminal upgrades located throughout the Peace Pipeline system. Phase VIII will add approximately 235,000 bpd of incremental capacity between Gordondale, Alberta and La Glace, Alberta, as well as approximately 65,000 bpd of capacity between La Glace, Alberta and the Namao hub near Edmonton, Alberta. Pipe manufacturing is complete and mainline construction activities have commenced. The estimated project cost has been revised lower to $475 million (previously $530 million). The revised cost reflects highly effective project management and execution, favorable weather conditions, and productive contractor relationships. The project is trending on time, with one pump station completed and two additional pump stations expected to be completed in the fourth quarter of 2023. The pipeline portion of Phase VIII is expected to enter service in the first half of 2024.
-
Pembina is actively progressing other pipeline projects, including a northeast British Columbia ("NEBC") infrastructure expansion, various laterals and tie-ins, and other projects to support ongoing system upgrades facilitating producer capture and improving market access.
The NEBC infrastructure expansion is currently underway and is expected to be completed in the second half of 2024. The expansion includes terminal upgrades, additional storage, and a new mid-point pump station, which will support approximately 40,000 bpd of incremental capacity on the NEBC Pipeline system. This capacity is needed to fulfill customer demand in light of growing volumes from NEBC and Pembina's previously announced long-term midstream service agreements with three premier NEBC Montney producers for the transportation and fractionation of liquids.
Facilities
- Pembina is constructing a new 55,000 bpd propane-plus fractionator ("RFS IV") at its existing Redwater fractionation and storage complex (the "Redwater Complex"). RFS IV is expected to cost approximately $460 million and will leverage the design, engineering and operating best practices of its existing facilities. The project includes additional rail loading capacity at the Redwater Complex. Subject to regulatory and environmental approvals, RFS IV is expected to be in-service in the first half of 2026 and is currently trending on time and on budget. With the addition of RFS IV, the fractionation capacity at the Redwater Complex will total 256,000 bpd. Engineering activities and ordering of long-lead equipment continue to progress. Pembina has received the key pre-construction regulatory approvals and site clearing activities have commenced.
Marketing & New Ventures
-
Pembina has formed a partnership with the Haisla Nation to develop the proposed Cedar LNG project, a three million tonne per annum floating LNG facility strategically positioned to leverage Canada's abundant natural gas supply and British Columbia's growing LNG infrastructure to produce industry-leading low-carbon, cost-competitive Canadian LNG for overseas markets. Cedar LNG will provide a valuable outlet for WCSB natural gas to access global markets and is expected to achieve higher prices for Canadian producers, contribute to lower overall emissions, and enhance global energy security. Given that Cedar LNG will be a floating facility, manufactured in the controlled conditions of a shipyard, it is expected that the project will have lower construction and execution risk. Further, powered by BC Hydro, Cedar LNG is expected to be one of the greenest LNG facilities in the world. Cedar LNG is structured as a tolling business providing a low risk, long-term cash flow stream, and strengthening Pembina's financial resilience.
Cedar LNG continues to progress key project deliverables, having secured the major regulatory approvals and signed non-binding Memorandums of Understanding for long-term liquefaction services with investment grade counterparties for the project’s total base liquefaction capacity. Remaining final investment decision ("FID") deliverables continue to progress, including finalizing the lump-sum engineering, procurement, and construction contract, the definitive liquefaction tolling agreements and the inter-project agreements with Coastal GasLink and LNG Canada. Target FID continues to be by the end of 2023, however, given the complexity and sequencing of aligning the multiple work streams, which are required to facilitate the project financing, FID may move into early 2024. - Pembina and TC Energy Corporation ("TC Energy") have formed a partnership to develop the Alberta Carbon Grid ("ACG"), a carbon transportation and sequestration platform that is intended to enable Alberta-based industries to effectively manage their GHG emissions, contribute positively to Alberta's lower-carbon economy, and create sustainable long-term value for Pembina and TC Energy stakeholders. The ACG is exploring options to create several hubs throughout Alberta. The first hub is the Industrial Heartland project, which will have the potential of transporting and storing up to ten million tonnes of carbon dioxide ("CO2") annually. The first phase of the Industrial Heartland project will have the potential of transporting and storing up to five million tonnes of CO2 annually. The ACG continues to progress surface and sub-surface engineering and planning, while engaging with customers and other stakeholders. In 2023, ACG licensed and purchased existing seismic data and completed the acquisition of new seismic data. This data will be integrated into subsurface geophysical models and help guide the location of an appraisal well to be drilled in November and December 2023.
Third Quarter 2023 Conference Call & Webcast
Pembina will host a conference call on Friday, November 3, 2023 at 8:00 a.m. MT (10:00 a.m. ET) for interested investors, analysts, brokers and media representatives to discuss results for the third quarter of 2023. The conference call dial-in numbers for Canada and the U.S. are 1-416-764-8624 or 1-888-259-6580. A recording of the conference call will be available for replay until Friday, November 10, 2023 at 11:59 p.m. ET. To access the replay, please dial either 1-416-764-8692 or 1-877-674-7070 and enter the password 901064#.
A live webcast of the conference call can be accessed on Pembina's website at www.pembina.com under Investor Centre/ Presentation & Events, or by entering:
https://events.q4inc.com/attendee/716734978 in your web browser. Shortly after the call, an audio archive will be posted on the website for a minimum of 90 days.
About Pembina
Pembina Pipeline Corporation is a leading energy transportation and midstream service provider that has served North America's energy industry for more than 65 years. Pembina owns an integrated network of hydrocarbon liquids and natural gas pipelines, gas gathering and processing facilities, oil and natural gas liquids infrastructure and logistics services, and an export terminals business. Through our integrated value chain, we seek to provide safe and reliable energy solutions that connect producers and consumers across the world, support a more sustainable future and benefit our customers, investors, employees and communities. For more information, please visit www.pembina.com.
Purpose of Pembina: We deliver extraordinary energy solutions so the world can thrive.
Pembina is structured into three Divisions: Pipelines Division, Facilities Division and Marketing & New Ventures Division.
Pembina's common shares trade on the Toronto and New York stock exchanges under PPL and PBA, respectively. For more information, visit www.pembina.com.
Forward-Looking Statements and Information
This news release contains certain forward-looking statements and forward-looking information (collectively, "forward-looking statements"), including forward-looking statements within the meaning of the "safe harbor" provisions of applicable securities legislation, that are based on Pembina's current expectations, estimates, projections and assumptions in light of its experience and its perception of historical trends. In some cases, forward-looking statements can be identified by terminology such as "continue", "anticipate", "will", "expects", "estimate", "potential", "planned", "future", "outlook", "strategy", "protect", "plan", "commit", "maintain", "focus", "ongoing", "believe" and similar expressions suggesting future events or future performance.
In particular, this news release contains forward-looking statements, including certain financial outlooks, pertaining to, without limitation, the following: Pembina's strategy and the development of new business initiatives and growth opportunities, including the anticipated benefits therefrom and the expected timing thereof; expectations about industry activities and development opportunities, including operating segment and general market conditions outlooks and industry developments for 2023 and thereafter; outlooks for commodity prices, demand, and the effect thereof on the business of the Company; expectations about future demand for Pembina's infrastructure and services; expectations relating to the development and anticipated benefits of Pembina's new projects and developments, including the Phase VIII Peace Pipeline expansion, Cedar LNG, RFS IV, ACG and the NEBC infrastructure expansion, including the timing thereof; expectations regarding the Trans Mountain Pipeline divestment process, including the timing thereof and Pembina's participation therein; expectations regarding the Trans Mountain Pipeline divestment process, including the timing thereof and Pembina's participation therein; Pembina's revised 2023 adjusted EBITDA guidance range; the Company's expectations in respect of full year 2023 cash flow from operating activities and future actions taken by Pembina in relation thereto; Pembina's future common share dividends, including the timing, amount and expected tax treatment thereof; planning, construction, locations, capital expenditure estimates, schedules, regulatory and environmental applications and anticipated approvals, expected capacity, incremental volumes, contractual arrangements, completion and in-service dates, rights, sources of product, activities, benefits and operations with respect to new construction of, repairs to or expansions on existing pipelines, systems, gas services facilities, processing and fractionation facilities, terminalling, storage and hub facilities and other facilities or energy infrastructure, as well as the impact of Pembina's new projects on its future financial performance and stakeholders; expectations regarding Pembina's financial strength and condition; expectations regarding Pembina's commercial agreements, including the expected timing and benefit thereof; statements and expectations related to Pembina's commitment to, and the effectiveness and impact of, its sustainability goals and targets; and the impact of current and expected market conditions on Pembina.
The forward-looking statements are based on certain factors and assumptions that Pembina has made in respect thereof as at the date of this news release regarding, among other things: oil and gas industry exploration and development activity levels and the geographic region of such activity; the success of Pembina's operations; prevailing commodity prices, interest rates, carbon prices, tax rates, exchange rates and inflation rates; the ability of Pembina to maintain current credit ratings; the availability and cost of capital to fund future capital requirements relating to existing assets, projects and the repayment or refinancing of existing debt as it becomes due; future operating costs; geotechnical and integrity costs; that any third-party projects relating to Pembina's growth projects will be sanctioned and completed as expected; assumptions with respect to our intention to complete share repurchases, including the funding thereof, existing and future market conditions, including with respect to Pembina's common share trading price, and compliance with respect to applicable securities laws and regulations and stock exchange policies; that any required commercial agreements can be reached in the manner and on the terms expected by Pembina; that all required regulatory and environmental approvals can be obtained on the necessary terms and in a timely manner; that counterparties will comply with contracts in a timely manner; that there are no unforeseen events preventing the performance of contracts or the completion of the relevant projects; prevailing regulatory, tax and environmental laws and regulations; maintenance of operating margins; the amount of future liabilities relating to lawsuits and environmental incidents; and the availability of coverage under Pembina's insurance policies (including in respect of Pembina's business interruption insurance policy).
Although Pembina believes the expectations and material factors and assumptions reflected in these forward-looking statements are reasonable as of the date hereof, there can be no assurance that these expectations, factors and assumptions will prove to be correct. These forward-looking statements are not guarantees of future performance and are subject to a number of known and unknown risks and uncertainties including, but not limited to: the regulatory environment and decisions and Indigenous and landowner consultation requirements; the impact of competitive entities and pricing; reliance on third parties to successfully operate and maintain certain assets; reliance on key relationships, joint venture partners and agreements; labour and material shortages; the strength and operations of the oil and natural gas production industry and related commodity prices; non-performance or default by counterparties to agreements which Pembina or one or more of its affiliates has entered into in respect of its business; actions by governmental or regulatory authorities, including changes in tax laws and treatment, changes in royalty rates, changes in regulatory processes or increased environmental regulation; the ability of Pembina to acquire or develop the necessary infrastructure in respect of future development projects; fluctuations in operating results; adverse general economic and market conditions, including potential recessions in Canada, North America and worldwide resulting in changes, or prolonged weaknesses, as applicable, in interest rates, foreign currency exchange rates, inflation rates, commodity prices, supply/demand trends and overall industry activity levels; constraints on the, or the unavailability of, adequate supplies, infrastructure or labour; the political environment in North American and elsewhere, and public opinion; the ability to access various sources of debt and equity capital; adverse changes in credit ratings; counterparty credit risk; technology and cyber security risks; natural catastrophes; and certain other risks detailed in Pembina's Annual Information Form and Management's Discussion and Analysis, each dated February 23, 2023 for the year ended December 31, 2022 and from time to time in Pembina's public disclosure documents available at www.sedarplus.ca, www.sec.gov and through Pembina's website at www.pembina.com.
This list of risk factors should not be construed as exhaustive. Readers are cautioned that events or circumstances could cause results to differ materially from those predicted, forecasted or projected by forward-looking statements contained herein. The forward-looking statements contained in this news release speak only as of the date of this news release. Pembina does not undertake any obligation to publicly update or revise any forward-looking statements or information contained herein, except as required by applicable laws. Management approved the revised 2023 adjusted EBITDA guidance contained herein as of the date of this news release. The purpose of the revised 2023 adjusted EBITDA guidance is to assist readers in understanding Pembina's expected and targeted financial results, and this information may not be appropriate for other purposes. The forward-looking statements contained in this news release are expressly qualified by this cautionary statement.
Non-GAAP and Other Financial Measures
Throughout this news release, Pembina has disclosed certain financial measures and ratios that are not specified, defined or determined in accordance with GAAP and which are not disclosed in Pembina's financial statements. Non-GAAP financial measures either exclude an amount that is included in, or include an amount that is excluded from, the composition of the most directly comparable financial measure specified, defined and determined in accordance with GAAP. Non-GAAP ratios are financial measures that are in the form of a ratio, fraction, percentage or similar representation that has a non-GAAP financial measure as one or more of its components. These non-GAAP financial measures and ratios, together with financial measures and ratios specified, defined and determined in accordance with GAAP, are used by management to evaluate the performance and cash flows of Pembina and its businesses and to provide additional useful information respecting Pembina's financial performance and cash flows to investors and analysts.
In this news release, Pembina has disclosed the following non-GAAP financial measures and non-GAAP ratios: net revenue, adjusted EBITDA, adjusted EBITDA from equity accounted investees, adjusted EBITDA per common share, adjusted cash flow from operating activities, adjusted cash flow from operating activities per common share; and proportionately consolidated debt-to-adjusted EBITDA. The non-GAAP financial measures and ratios disclosed in this news release do not have any standardized meaning under International Financial Reporting Standards ("IFRS") and may not be comparable to similar financial measures or ratios disclosed by other issuers. Such financial measures and ratios should not, therefore, be considered in isolation or as a substitute for, or superior to, measures and ratios of Pembina's financial performance, or cash flows specified, defined or determined in accordance with IFRS, including revenue, earnings, cash flow from operating activities and cash flow from operating activities per share.
Except as otherwise described herein, these non-GAAP financial measures and non-GAAP ratios are calculated on a consistent basis from period to period. Specific reconciling items may only be relevant in certain periods.
Below is a description of each non-GAAP financial measure and non-GAAP ratio disclosed in this news release, together with, as applicable, disclosure of the most directly comparable financial measure that is determined in accordance with GAAP to which each non-GAAP financial measure relates and a quantitative reconciliation of each non-GAAP financial measure to such directly comparable GAAP financial measure. Additional information relating to such non-GAAP financial measures and non-GAAP ratios, including disclosure of the composition of each non-GAAP financial measure and non-GAAP ratio, an explanation of how each non-GAAP financial measure and non-GAAP ratio provides useful information to investors and the additional purposes, if any, for which management uses each non-GAAP financial measure and non-GAAP ratio; an explanation of the reason for any change in the label or composition of each non-GAAP financial measure and non-GAAP ratio from what was previously disclosed; and a description of any significant difference between forward-looking non-GAAP financial measures and the equivalent historical non-GAAP financial measures, is contained in the "Non-GAAP & Other Financial Measures" section of the management's discussion and analysis of Pembina dated November 2, 2023 for the three and nine months ended September 30, 2023 (the "MD&A"), which information is incorporated by reference in this news release. The MD&A is available on SEDAR+ at www.sedarplus.ca, EDGAR at www.sec.gov and Pembina's website at www.pembina.com.
Net Revenue
Net revenue is a non-GAAP financial measure which is defined as total revenue less cost of goods sold including product purchases. The most directly comparable financial measure to net revenue that is determined in accordance with GAAP and disclosed in Pembina's financial statements is revenue.
3 Months Ended September 30 |
Pipelines |
Facilities |
Marketing & New Ventures |
Corporate & Inter-segment Eliminations |
Total |
|||||
($ millions) |
||||||||||
|
2023 |
2022 |
2023 |
2022 |
2023 |
2022 |
2023 |
2022 |
2023 |
2022 |
Revenue |
734 |
645 |
233 |
314 |
1,512 |
1,979 |
(187) |
(159) |
2,292 |
2,779 |
Cost of goods sold, including product purchases |
6 |
— |
— |
4 |
1,347 |
1,824 |
(134) |
(79) |
1,219 |
1,749 |
Net revenue |
728 |
645 |
233 |
310 |
165 |
155 |
(53) |
(80) |
1,073 |
1,030 |
9 Months Ended September 30 |
Pipelines |
Facilities |
Marketing & New Ventures |
Corporate & Inter-segment Eliminations |
Total |
|||||
($ millions) |
||||||||||
|
2023 |
2022 |
2023 |
2022 |
2023 |
2022 |
2023 |
2022 |
2023 |
2022 |
Revenue |
1,970 |
1,822 |
661 |
1,031 |
4,427 |
6,550 |
(399) |
(491) |
6,659 |
8,912 |
Cost of goods sold, including product purchases |
6 |
— |
— |
6 |
4,033 |
5,948 |
(257) |
(246) |
3,782 |
5,708 |
Net revenue |
1,964 |
1,822 |
661 |
1,025 |
394 |
602 |
(142) |
(245) |
2,877 |
3,204 |
Adjusted Earnings Before Interest, Taxes, Depreciation and Amortization
Adjusted EBITDA is a non-GAAP financial measure and is calculated as earnings before net finance costs, income taxes, depreciation and amortization (included in operations and general and administrative expense) and unrealized gains or losses on commodity-related derivative financial instruments. The exclusion of unrealized gains or losses on commodity-related derivative financial instruments eliminates the non-cash impact of such gains or losses.
Adjusted EBITDA also includes adjustments to earnings for losses (gains) on disposal of assets, transaction costs incurred in respect of acquisitions, dispositions and restructuring, impairment charges or reversals in respect of goodwill, intangible assets, investments in equity accounted investees and property, plant and equipment, certain non-cash provisions and other amounts not reflective of ongoing operations. These additional adjustments are made to exclude various non-cash and other items that are not reflective of ongoing operations.
Adjusted EBITDA per common share is a non-GAAP ratio which is calculated by dividing adjusted EBITDA by the weighted average number of common shares outstanding.
3 Months Ended September 30 |
Pipelines |
Facilities |
Marketing & New Ventures |
Corporate & Inter-segment Eliminations |
Total |
|||||
($ millions, except per share amounts) |
||||||||||
|
2023 |
2022 |
2023 |
2022 |
2023 |
2022 |
2023 |
2022 |
2023 |
2022 |
Earnings (loss) before income tax |
437 |
377 |
179 |
1,273 |
(4) |
249 |
(170) |
(158) |
442 |
1,741 |
Adjustments to share of profit from equity accounted investees and other |
42 |
40 |
100 |
96 |
65 |
(12) |
— |
— |
207 |
124 |
Net finance cost |
7 |
7 |
2 |
1 |
11 |
23 |
110 |
109 |
130 |
140 |
Depreciation and amortization |
104 |
97 |
38 |
27 |
11 |
12 |
11 |
10 |
164 |
146 |
Unrealized loss (gain) on commodity-related derivative financial instruments |
— |
— |
— |
3 |
78 |
(105) |
— |
— |
78 |
(102) |
Gain on PGI Transaction |
— |
— |
— |
(1,110) |
— |
— |
— |
— |
— |
(1,110) |
Transaction costs incurred in respect of acquisitions, loss on disposal of assets and non-cash provisions |
1 |
14 |
— |
1 |
(2) |
13 |
1 |
— |
— |
28 |
Adjusted EBITDA |
591 |
535 |
319 |
291 |
159 |
180 |
(48) |
(39) |
1,021 |
967 |
Adjusted EBITDA per common share – basic (dollars) |
|
|
|
|
|
|
|
|
1.86 |
1.74 |
9 Months Ended September 30 |
Pipelines |
Facilities |
Marketing & New Ventures |
Corporate & Inter-segment Eliminations |
Total |
|||||
($ millions, except per share amounts) |
||||||||||
|
2023 |
2022 |
2023 |
2022 |
2023 |
2022 |
2023 |
2022 |
2023 |
2022 |
Earnings (loss) before income tax |
1,163 |
1,120 |
467 |
1,670 |
231 |
601 |
(487) |
(502) |
1,374 |
2,889 |
Adjustments to share of profit from equity accounted investees and other |
127 |
131 |
303 |
164 |
78 |
25 |
— |
— |
508 |
320 |
Net finance costs |
22 |
22 |
6 |
10 |
8 |
32 |
314 |
309 |
350 |
373 |
Depreciation and amortization |
305 |
292 |
113 |
162 |
34 |
34 |
33 |
33 |
485 |
521 |
Unrealized (gain) loss on commodity-related derivative financial instruments |
— |
— |
— |
(48) |
78 |
(144) |
— |
— |
78 |
(192) |
Gain on PGI Transaction |
— |
— |
— |
(1,110) |
— |
— |
— |
— |
— |
(1,110) |
Transaction costs incurred in respect of acquisitions, transformation and restructuring costs, contract dispute settlement, gain on disposal of assets and non-cash provisions |
— |
14 |
— |
1 |
(5) |
2 |
1 |
3 |
(4) |
20 |
Adjusted EBITDA |
1,617 |
1,579 |
889 |
849 |
424 |
550 |
(139) |
(157) |
2,791 |
2,821 |
Adjusted EBITDA per common share – basic (dollars) |
|
|
|
|
|
|
|
|
5.08 |
5.10 |
2023 Adjusted EBITDA Guidance
The equivalent historical non-GAAP financial measure to 2023 adjusted EBITDA guidance is adjusted EBITDA for the year ended December 31, 2022.
12 Months Ended December 31, 2022 |
Pipelines |
Facilities |
Marketing & New Ventures |
Corporate & Inter-segment Eliminations |
Total |
($ millions, except per share amounts) |
|||||
Earnings (loss) before income tax |
1,415 |
1,787 |
708 |
(708) |
3,202 |
Adjustments to share of profit from equity accounted investees and other |
172 |
288 |
25 |
— |
485 |
Net finance costs (income) |
28 |
13 |
27 |
418 |
486 |
Depreciation and amortization |
396 |
196 |
44 |
47 |
683 |
Unrealized gain on commodity-related derivative financial instruments |
— |
(50) |
(83) |
— |
(133) |
Gain on PGI Transaction |
— |
(1,110) |
— |
— |
(1,110) |
Transaction costs incurred in respect of acquisitions |
— |
(1) |
— |
— |
(1) |
Impairment charges, transformation and restructuring costs, contract dispute settlement, (gain) loss on disposal of assets and non-cash provisions |
116 |
14 |
— |
4 |
134 |
Adjusted EBITDA |
2,127 |
1,137 |
721 |
(239) |
3,746 |
Adjusted EBITDA per common share – basic (dollars) |
|
|
|
|
6.78 |
Adjusted EBITDA from Equity Accounted Investees
In accordance with IFRS, Pembina's jointly controlled investments are accounted for using equity accounting. Under equity accounting, the assets and liabilities of the investment are presented net in a single line item in the Consolidated Statement of Financial Position, "Investments in Equity Accounted Investees". Net earnings from investments in equity accounted investees are recognized in a single line item in the Consolidated Statement of Earnings and Comprehensive Income "Share of Profit from Equity Accounted Investees". The adjustments made to earnings, in adjusted EBITDA above, are also made to share of profit from investments in equity accounted investees. Cash contributions and distributions from investments in equity accounted investees represent Pembina's share paid and received in the period to and from the investments in equity accounted investees.
To assist in understanding and evaluating the performance of these investments, Pembina is supplementing the IFRS disclosure with non-GAAP proportionate consolidation of Pembina's interest in the investments in equity accounted investees. Pembina's proportionate interest in equity accounted investees has been included in adjusted EBITDA.
3 Months Ended September 30 |
Pipelines |
Facilities |
Marketing & New Ventures |
Total |
||||
($ millions) |
||||||||
|
2023 |
2022 |
2023 |
2022 |
2023 |
2022 |
2023 |
2022 |
Share of profit (loss) from equity accounted investees |
23 |
39 |
68 |
15 |
(48) |
69 |
43 |
123 |
Adjustments to share of profit from equity accounted investees: |
|
|
|
|
|
|
|
|
Net finance costs |
5 |
2 |
22 |
23 |
1 |
2 |
28 |
27 |
Income tax (recovery) expense |
(1) |
— |
20 |
1 |
— |
— |
19 |
1 |
Depreciation and amortization |
38 |
38 |
51 |
50 |
6 |
6 |
95 |
94 |
Unrealized loss (gain) on commodity-related derivative financial instruments |
— |
— |
— |
16 |
— |
(20) |
— |
(4) |
Transaction costs incurred in respect of acquisitions, non-cash provisions and other |
— |
— |
7 |
6 |
58 |
— |
65 |
6 |
Total adjustments to share of profit from equity accounted investees |
42 |
40 |
100 |
96 |
65 |
(12) |
207 |
124 |
Adjusted EBITDA from equity accounted investees |
65 |
79 |
168 |
111 |
17 |
57 |
250 |
247 |
9 Months Ended September 30 |
Pipelines |
Facilities |
Marketing & New Ventures |
Total |
||||
($ millions) |
||||||||
|
2023 |
2022 |
2023 |
2022 |
2023 |
2022 |
2023 |
2022 |
Share of profit (loss) from equity accounted investees |
78 |
127 |
185 |
59 |
(41) |
96 |
222 |
282 |
Adjustments to share of profit from equity accounted investees: |
|
|
|
|
|
|
|
|
Net finance costs |
15 |
18 |
76 |
42 |
1 |
1 |
92 |
61 |
Income tax expense |
— |
— |
54 |
1 |
— |
— |
54 |
1 |
Depreciation and amortization |
112 |
113 |
147 |
99 |
19 |
18 |
278 |
230 |
Unrealized loss on commodity-related derivative financial instruments |
— |
— |
9 |
16 |
— |
6 |
9 |
22 |
Transaction costs incurred in respect of acquisitions, non-cash provisions and other |
— |
— |
17 |
6 |
58 |
— |
75 |
6 |
Total adjustments to share of profit from equity accounted investees |
127 |
131 |
303 |
164 |
78 |
25 |
508 |
320 |
Adjusted EBITDA from equity accounted investees |
205 |
258 |
488 |
223 |
37 |
121 |
730 |
602 |
Adjusted Cash Flow from Operating Activities and Adjusted Cash Flow from Operating Activities per Common Share
Adjusted cash flow from operating activities is a non-GAAP financial measure which is defined as cash flow from operating activities adjusting for the change in non-cash operating working capital, adjusting for current tax and share-based compensation payment, and deducting preferred share dividends paid. Adjusted cash flow from operating activities deducts preferred share dividends paid because they are not attributable to common shareholders. The calculation has been modified to include current tax and share-based compensation payment as it allows management to better assess the obligations discussed below.
Management believes that adjusted cash flow from operating activities provides comparable information to investors for assessing financial performance during each reporting period. Management utilizes adjusted cash flow from operating activities to set objectives and as a key performance indicator of the Company's ability to meet interest obligations, dividend payments and other commitments.
Adjusted cash flow from operating activities per common share is a non-GAAP ratio which is calculated by dividing adjusted cash flow from operating activities by the weighted average number of common shares outstanding.
|
3 Months Ended
|
9 Months Ended
|
||
($ millions, except per share amounts) |
2023 |
2022 |
2023 |
2022 |
Cash flow from operating activities |
644 |
723 |
1,755 |
1,982 |
Cash flow from operating activities per common share – basic (dollars) |
1.17 |
1.30 |
3.19 |
3.58 |
Add (deduct): |
|
|
|
|
Change in non-cash operating working capital |
76 |
(99) |
264 |
43 |
Current tax expense |
(94) |
(70) |
(271) |
(245) |
Taxes paid, net of foreign exchange |
74 |
68 |
187 |
306 |
Accrued share-based payment expense |
(10) |
(3) |
(23) |
(66) |
Share-based compensation payment |
— |
— |
77 |
45 |
Preferred share dividends paid |
(31) |
(31) |
(90) |
(94) |
Adjusted cash flow from operating activities |
659 |
588 |
1,899 |
1,971 |
Adjusted cash flow from operating activities per common share – basic (dollars) |
1.20 |
1.07 |
3.45 |
3.57 |
Proportionately Consolidated Debt-to-Adjusted EBITDA
Proportionately Consolidated Debt-to-Adjusted EBITDA is a non-GAAP ratio that management believes is useful to investors and other users of Pembina’s financial information in the evaluation of the Company’s debt levels and creditworthiness
|
12 Months Ended |
|
($ millions, except as noted) |
September 30, 2023 |
December 31, 2022 |
Loans and borrowings (current) |
650 |
600 |
Loans and borrowings (non-current) |
9,329 |
9,405 |
Loans and borrowings of equity accounted investees |
2,781 |
3,366 |
Proportionately consolidated debt |
12,760 |
13,371 |
Adjusted EBITDA |
3,716 |
3,746 |
Proportionately consolidated debt-to-adjusted EBITDA (times) |
3.4 |
3.6 |
($ millions) |
12 Months Ended September 30, 2023 |
9 Months Ended September 30, 2023 |
12 Months Ended December 31, 2022 |
9 Months Ended September 30, 2022 |
Earnings before income tax |
1,687 |
1,374 |
3,219 |
2,889 |
Adjustments to share of profit from equity accounted investees and other |
673 |
508 |
468 |
320 |
Net finance costs |
463 |
350 |
486 |
373 |
Depreciation and amortization |
647 |
485 |
683 |
521 |
Unrealized gain on commodity-related derivative financial instruments |
137 |
78 |
(133) |
(192) |
Gain on PGI Transaction |
— |
— |
(1,110) |
(1,110) |
Transaction costs incurred in respect of acquisitions |
— |
— |
(1) |
(1) |
Impairment charges, transformation and restructuring costs, contract dispute settlement, (gain) loss on disposal of assets and non-cash provisions |
109 |
(4) |
134 |
21 |
Adjusted EBITDA |
3,716 |
2,791 |
3,746 |
2,821 |
|
=A+B-C |
A |
B |
C |
View source version on businesswire.com: https://www.businesswire.com/news/home/20231102235590/en/
Contacts
Investor Relations
(403) 231-3156
1-855-880-7404
e-mail: investor-relations@pembina.com
www.pembina.com


