

Real estate data provider CoStar Group (NASDAQ: CSGP) announced better-than-expected revenue in Q3 CY2025, with sales up 20.4% year on year to $833.6 million. On top of that, next quarter’s revenue guidance ($890 million at the midpoint) was surprisingly good and 3.3% above what analysts were expecting. Its non-GAAP profit of $0.23 per share was 21.8% above analysts’ consensus estimates.
Is now the time to buy CoStar? Find out by accessing our full research report, it’s free for active Edge members.
CoStar (CSGP) Q3 CY2025 Highlights:
- Revenue: $833.6 million vs analyst estimates of $814.4 million (20.4% year-on-year growth, 2.4% beat)
- Adjusted EPS: $0.23 vs analyst estimates of $0.19 (21.8% beat)
- Adjusted EBITDA: $115 million vs analyst estimates of $93.33 million (13.8% margin, 23.2% beat)
- Revenue Guidance for Q4 CY2025 is $890 million at the midpoint, above analyst estimates of $861.3 million
- Adjusted EPS guidance for Q4 CY2025 is $0.27 at the midpoint, below analyst estimates of $0.30
- EBITDA guidance for the full year is $420 million at the midpoint, above analyst estimates of $409.7 million
- Operating Margin: -6.1%, down from 3.4% in the same quarter last year
- Free Cash Flow Margin: 26.7%, up from 2% in the same quarter last year
- Market Capitalization: $33.1 billion
“We had an outstanding Q3 2025 as we delivered our 58th consecutive quarter of double-digit revenue growth with a 20% year-over-year increase in revenue,” said Andy Florance, Founder and Chief Executive Officer of CoStar Group.
Company Overview
With a research department that makes over 10,000 property updates daily to its 35-year-old database, CoStar Group (NASDAQ: CSGP) provides comprehensive real estate data, analytics, and online marketplaces for commercial and residential properties in the U.S. and U.K.
Revenue Growth
A company’s long-term sales performance can indicate its overall quality. Even a bad business can shine for one or two quarters, but a top-tier one grows for years.
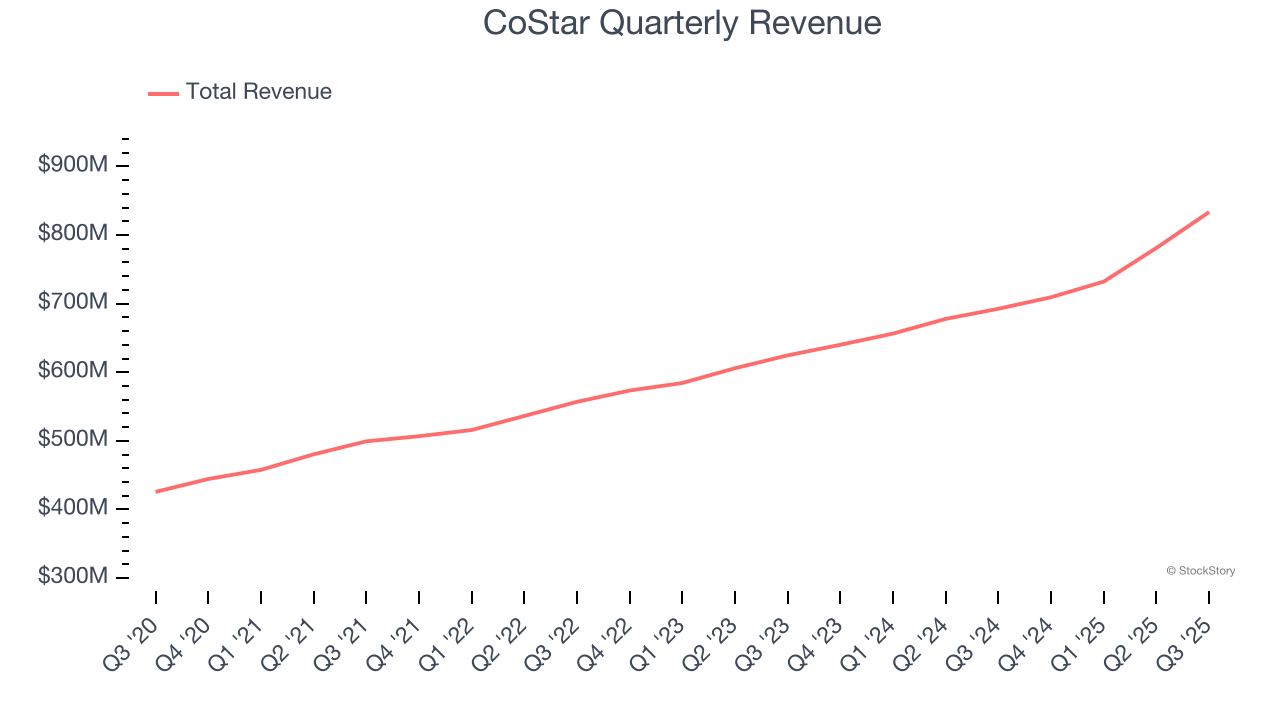
With $3.06 billion in revenue over the past 12 months, CoStar is a mid-sized business services company, which sometimes brings disadvantages compared to larger competitors benefiting from better economies of scale. On the bright side, it can still flex high growth rates because it’s working from a smaller revenue base.
As you can see below, CoStar’s sales grew at an exceptional 14% compounded annual growth rate over the last five years. This shows it had high demand, a useful starting point for our analysis.
We at StockStory place the most emphasis on long-term growth, but within business services, a half-decade historical view may miss recent innovations or disruptive industry trends. CoStar’s annualized revenue growth of 13.1% over the last two years aligns with its five-year trend, suggesting its demand was predictably strong. 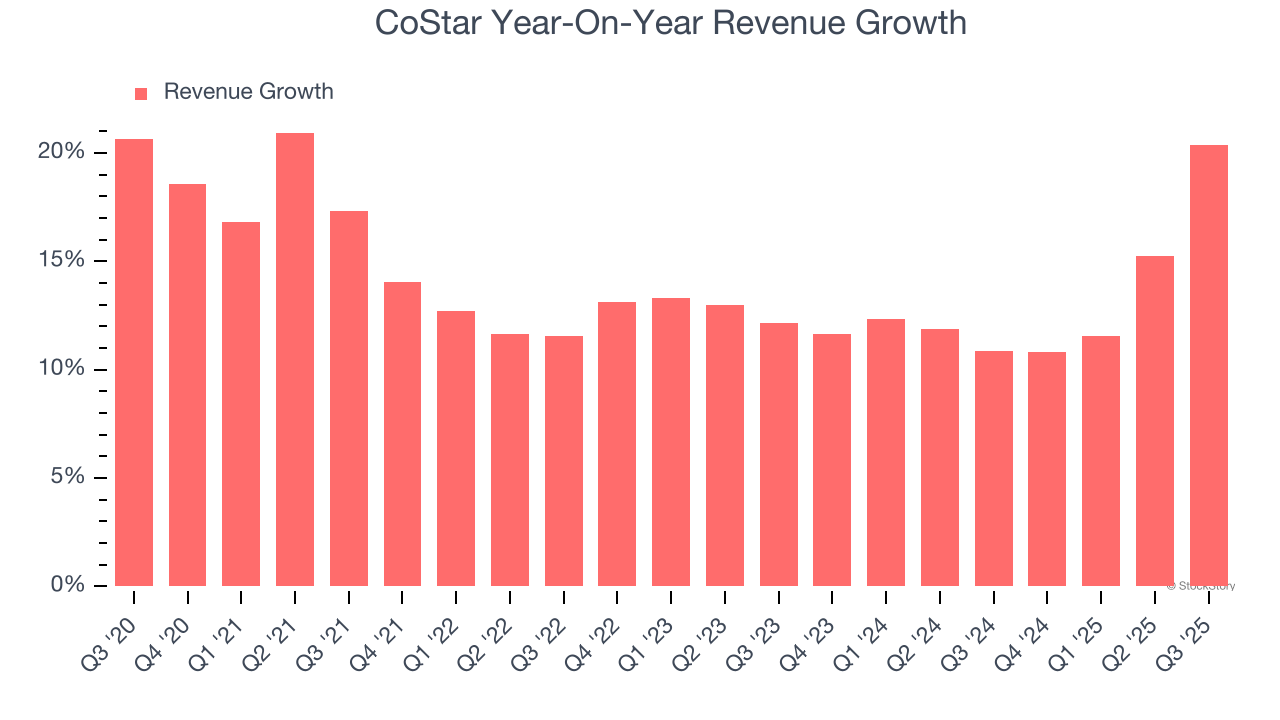
This quarter, CoStar reported robust year-on-year revenue growth of 20.4%, and its $833.6 million of revenue topped Wall Street estimates by 2.4%. Company management is currently guiding for a 25.5% year-on-year increase in sales next quarter.
Looking further ahead, sell-side analysts expect revenue to grow 16.9% over the next 12 months, an improvement versus the last two years. This projection is eye-popping and suggests its newer products and services will catalyze better top-line performance.
Unless you’ve been living under a rock, it should be obvious by now that generative AI is going to have a huge impact on how large corporations do business. While Nvidia and AMD are trading close to all-time highs, we prefer a lesser-known (but still profitable) stock benefiting from the rise of AI. Click here to access our free report one of our favorites growth stories.
Operating Margin
Operating margin is an important measure of profitability as it shows the portion of revenue left after accounting for all core expenses – everything from the cost of goods sold to advertising and wages. It’s also useful for comparing profitability across companies with different levels of debt and tax rates because it excludes interest and taxes.
CoStar was profitable over the last five years but held back by its large cost base. Its average operating margin of 9.1% was weak for a business services business.
Looking at the trend in its profitability, CoStar’s operating margin decreased by 21.1 percentage points over the last five years. This raises questions about the company’s expense base because its revenue growth should have given it leverage on its fixed costs, resulting in better economies of scale and profitability. CoStar’s performance was poor no matter how you look at it - it shows that costs were rising and it couldn’t pass them onto its customers.
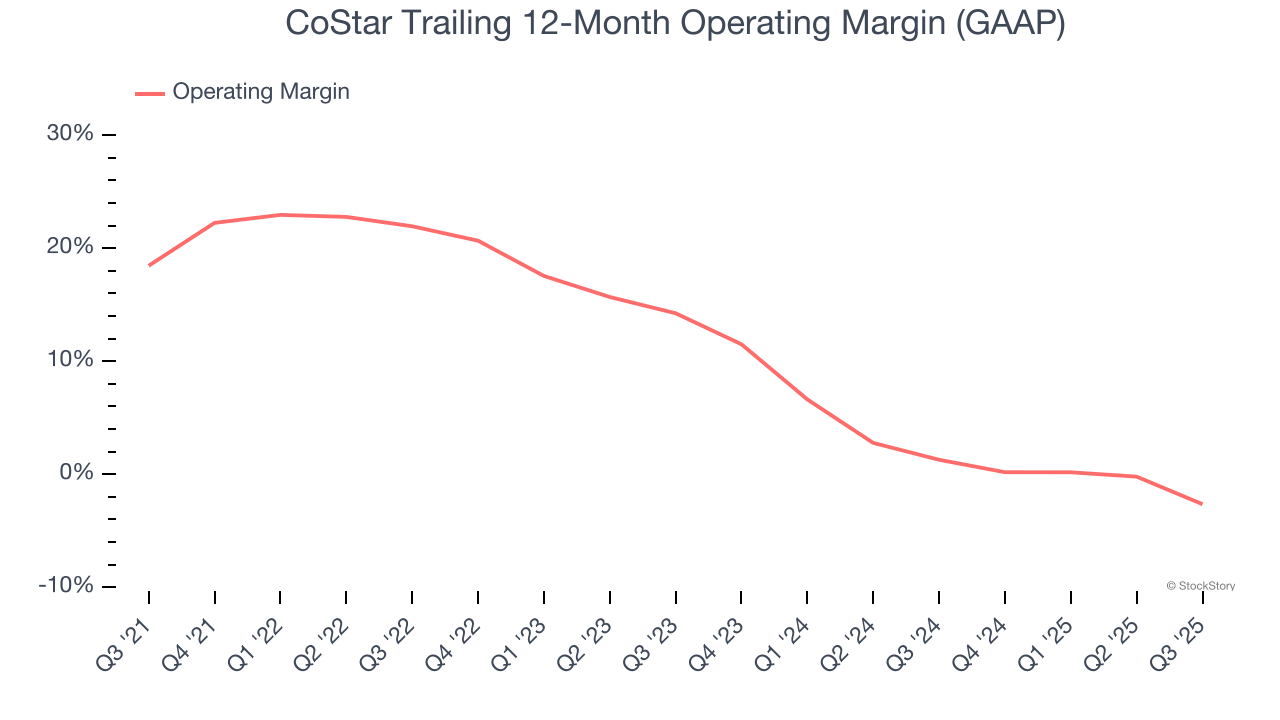
In Q3, CoStar generated an operating margin profit margin of negative 6.1%, down 9.6 percentage points year on year. This contraction shows it was less efficient because its expenses grew faster than its revenue.
Earnings Per Share
We track the long-term change in earnings per share (EPS) for the same reason as long-term revenue growth. Compared to revenue, however, EPS highlights whether a company’s growth is profitable.
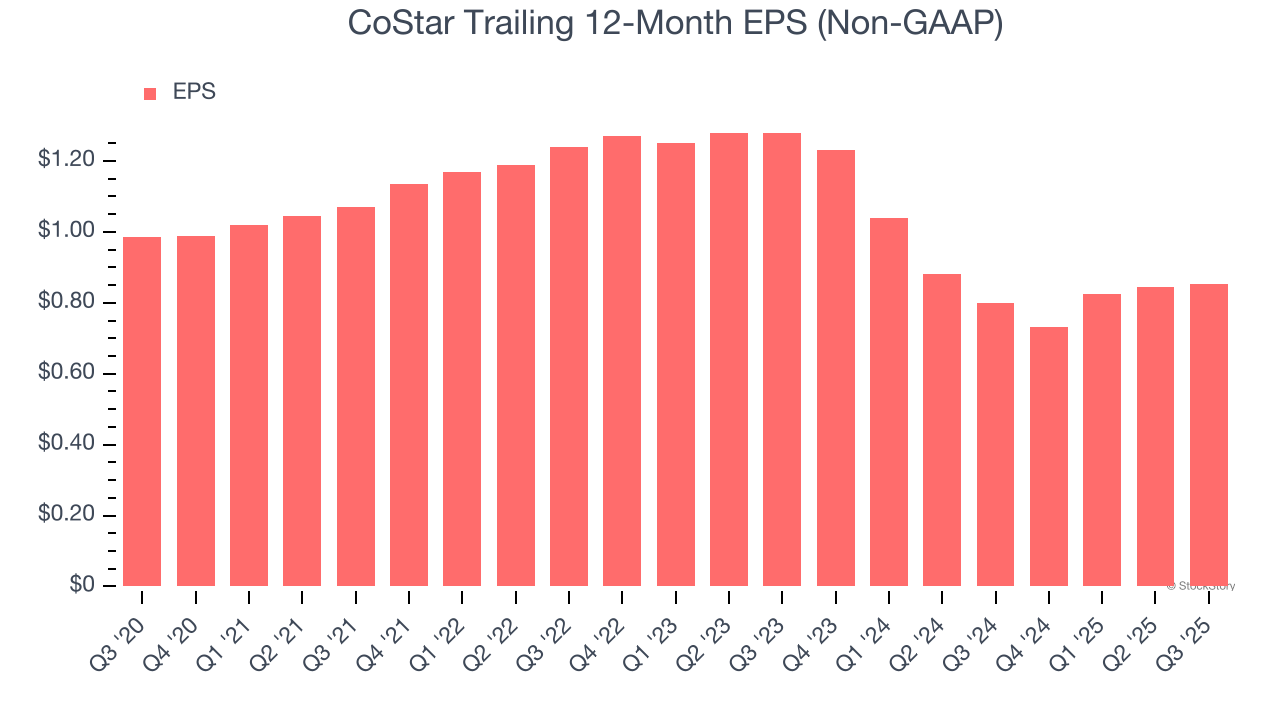
Sadly for CoStar, its EPS declined by 2.8% annually over the last five years while its revenue grew by 14%. This tells us the company became less profitable on a per-share basis as it expanded.
Diving into the nuances of CoStar’s earnings can give us a better understanding of its performance. As we mentioned earlier, CoStar’s operating margin declined by 21.1 percentage points over the last five years. Its share count also grew by 6.6%, meaning the company not only became less efficient with its operating expenses but also diluted its shareholders. 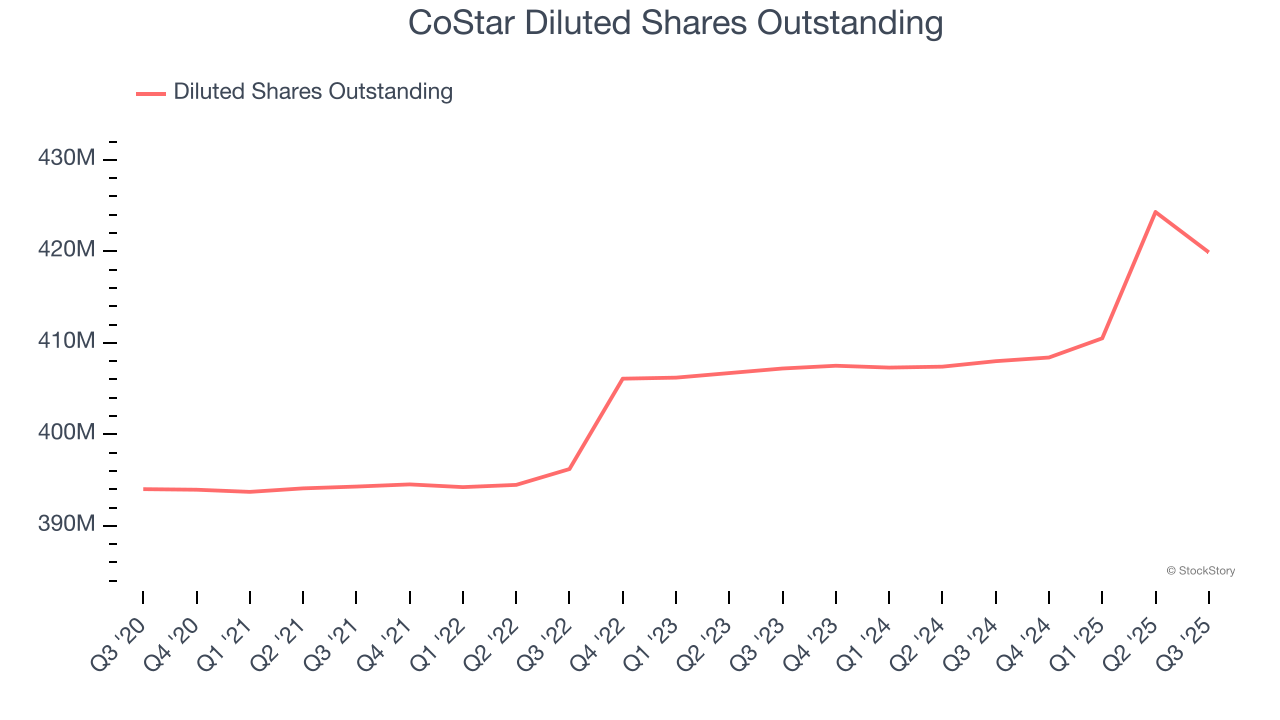
Like with revenue, we analyze EPS over a more recent period because it can provide insight into an emerging theme or development for the business.
For CoStar, its two-year annual EPS declines of 18.3% show it’s continued to underperform. These results were bad no matter how you slice the data, but given it was successful in other measures of financial health, we’re hopeful CoStar can generate earnings growth in the future.
In Q3, CoStar reported adjusted EPS of $0.23, up from $0.22 in the same quarter last year. This print easily cleared analysts’ estimates, and shareholders should be content with the results. Over the next 12 months, Wall Street expects CoStar’s full-year EPS of $0.85 to grow 46.2%.
Key Takeaways from CoStar’s Q3 Results
It was good to see CoStar beat analysts’ revenue, EPS, and EBITDA expectations this quarter as its sales growth accelerated. We were also glad its revenue and EBITDA guidance for next quarter trumped Wall Street’s estimates. On the other hand, its quarterly EPS guidance missed. Still, we think this was a solid quarter with some key areas of upside. Investors were likely hoping for more given the stock's premium valuation, and shares traded down 2.8% to $76.07 immediately following the results.
So do we think CoStar is an attractive buy at the current price? If you’re making that decision, you should consider the bigger picture of valuation, business qualities, as well as the latest earnings. We cover that in our actionable full research report which you can read here, it’s free for active Edge members.


