

IT solutions provider Connection (NASDAQ: CNXN) missed Wall Street’s revenue expectations in Q3 CY2025, with sales falling 2.2% year on year to $709.1 million. Its non-GAAP profit of $0.97 per share was 3.5% below analysts’ consensus estimates.
Is now the time to buy Connection? Find out by accessing our full research report, it’s free for active Edge members.
Connection (CNXN) Q3 CY2025 Highlights:
- Revenue: $709.1 million vs analyst estimates of $743.7 million (2.2% year-on-year decline, 4.7% miss)
- Adjusted EPS: $0.97 vs analyst expectations of $1.01 (3.5% miss)
- Adjusted EBITDA: $35.59 million vs analyst estimates of $36.07 million (5% margin, 1.3% miss)
- Operating Margin: 4.3%, in line with the same quarter last year
- Free Cash Flow Margin: 8.8%, up from 7.1% in the same quarter last year
- Market Capitalization: $1.59 billion
Company Overview
Starting as a small computer products seller in 1982 and evolving into a Fortune 1000 company, Connection (NASDAQ: CNXN) is a technology solutions provider that helps businesses and government agencies design, purchase, implement, and manage their IT infrastructure and systems.
Revenue Growth
Examining a company’s long-term performance can provide clues about its quality. Any business can experience short-term success, but top-performing ones enjoy sustained growth for years.
With $2.88 billion in revenue over the past 12 months, Connection is a mid-sized business services company, which sometimes brings disadvantages compared to larger competitors benefiting from better economies of scale.
As you can see below, Connection’s 1.8% annualized revenue growth over the last five years was sluggish. This shows it failed to generate demand in any major way and is a rough starting point for our analysis.
Long-term growth is the most important, but within business services, a half-decade historical view may miss new innovations or demand cycles. Connection’s recent performance shows its demand has slowed as its revenue was flat over the last two years. 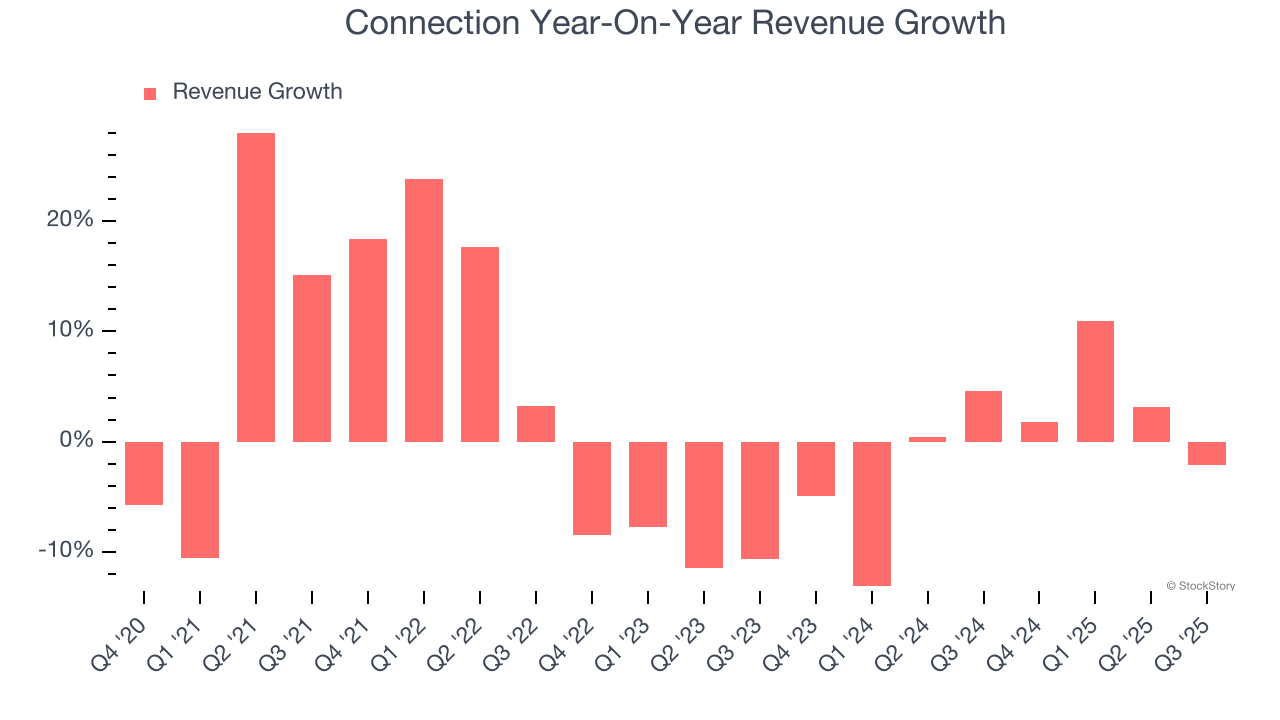
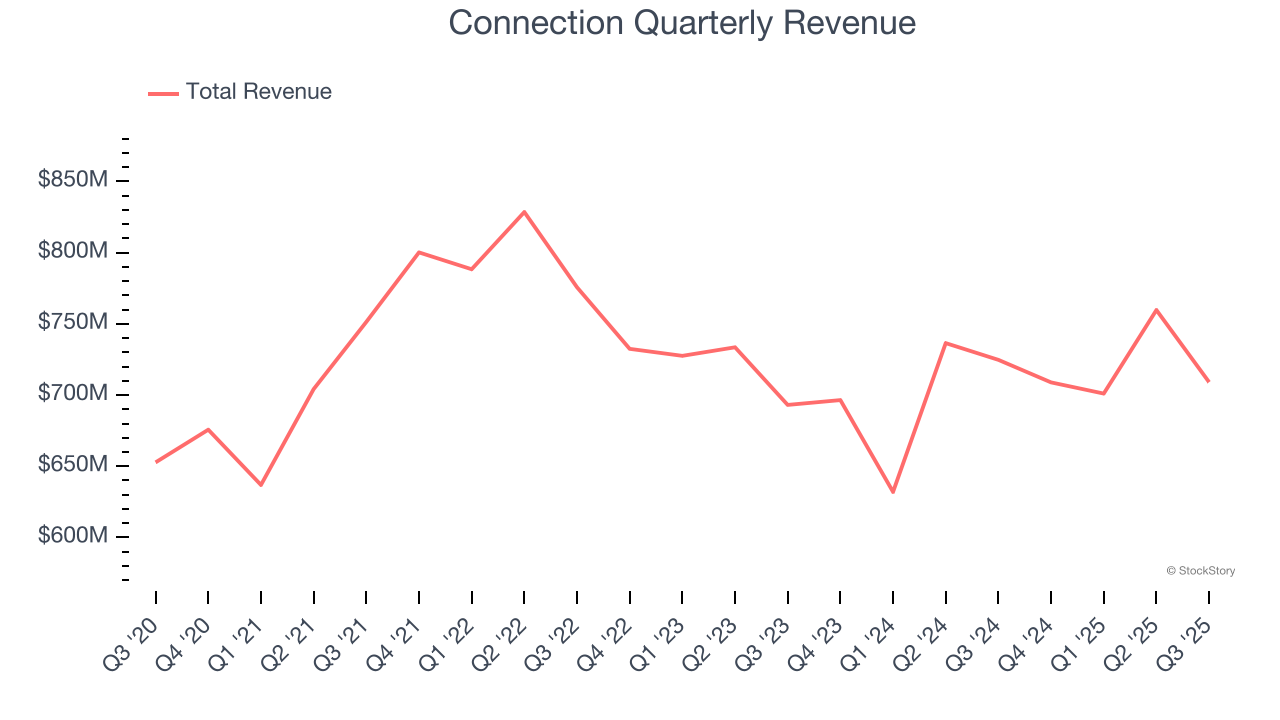
This quarter, Connection missed Wall Street’s estimates and reported a rather uninspiring 2.2% year-on-year revenue decline, generating $709.1 million of revenue.
Looking ahead, sell-side analysts expect revenue to grow 6.6% over the next 12 months, an improvement versus the last two years. This projection is above average for the sector and suggests its newer products and services will catalyze better top-line performance.
Today’s young investors won’t have read the timeless lessons in Gorilla Game: Picking Winners In High Technology because it was written more than 20 years ago when Microsoft and Apple were first establishing their supremacy. But if we apply the same principles, then enterprise software stocks leveraging their own generative AI capabilities may well be the Gorillas of the future. So, in that spirit, we are excited to present our Special Free Report on a profitable, fast-growing enterprise software stock that is already riding the automation wave and looking to catch the generative AI next.
Operating Margin
Operating margin is one of the best measures of profitability because it tells us how much money a company takes home after subtracting all core expenses, like marketing and R&D.
Connection’s operating margin might fluctuated slightly over the last 12 months but has generally stayed the same, averaging 3.6% over the last five years. This profitability was lousy for a business services business and caused by its suboptimal cost structure.
Looking at the trend in its profitability, Connection’s operating margin might fluctuated slightly but has generally stayed the same over the last five years. This raises questions about the company’s expense base because its revenue growth should have given it leverage on its fixed costs, resulting in better economies of scale and profitability.
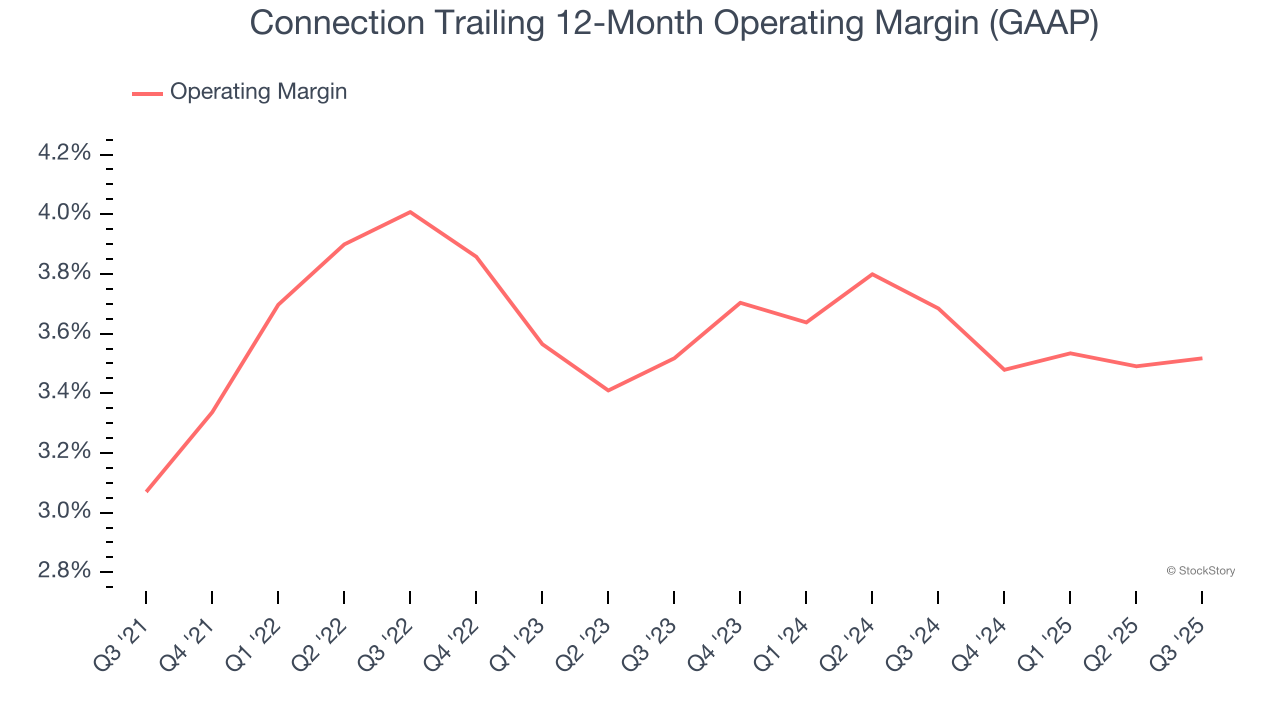
In Q3, Connection generated an operating margin profit margin of 4.3%, in line with the same quarter last year. This indicates the company’s overall cost structure has been relatively stable.
Earnings Per Share
Revenue trends explain a company’s historical growth, but the long-term change in earnings per share (EPS) points to the profitability of that growth – for example, a company could inflate its sales through excessive spending on advertising and promotions.
Connection’s EPS grew at an unimpressive 7.2% compounded annual growth rate over the last five years. On the bright side, this performance was better than its 1.8% annualized revenue growth and tells us the company became more profitable on a per-share basis as it expanded.
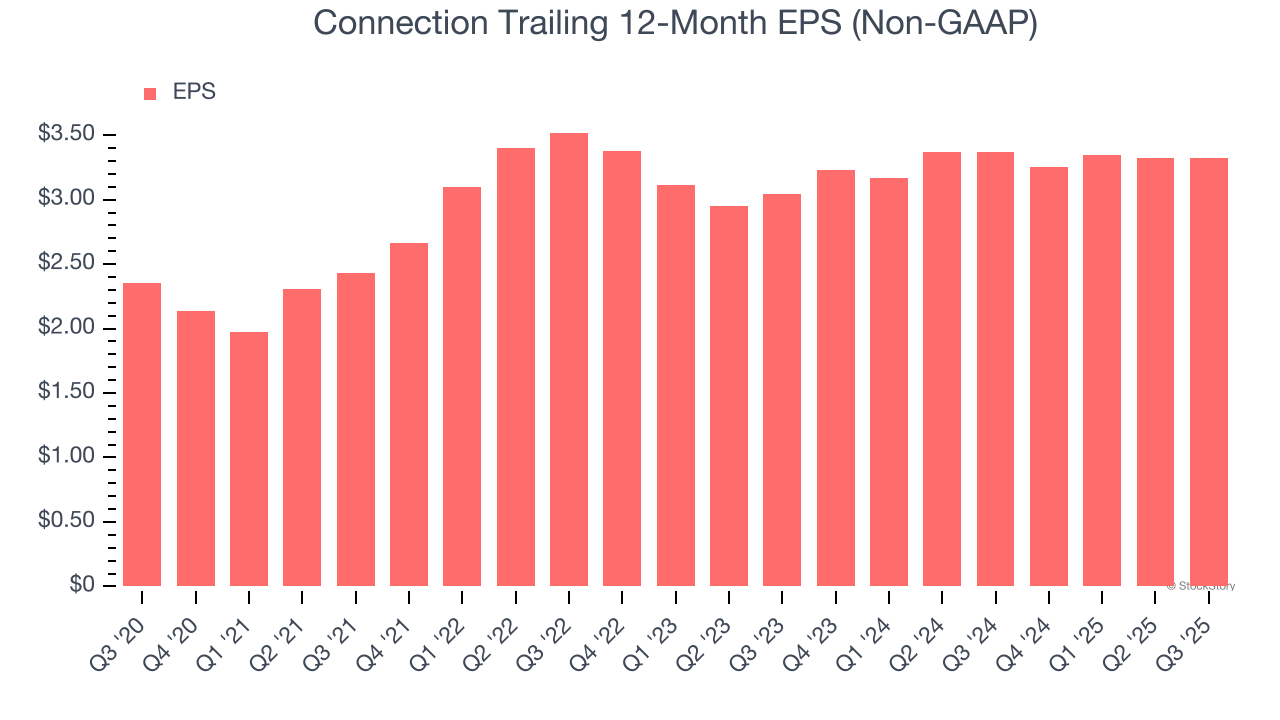
Like with revenue, we analyze EPS over a more recent period because it can provide insight into an emerging theme or development for the business.
For Connection, its two-year annual EPS growth of 4.5% was lower than its five-year trend. We hope its growth can accelerate in the future.
In Q3, Connection reported adjusted EPS of $0.97, in line with the same quarter last year. This print missed analysts’ estimates. Over the next 12 months, Wall Street expects Connection’s full-year EPS of $3.32 to grow 15.1%.
Key Takeaways from Connection’s Q3 Results
We struggled to find many positives in these results. Its revenue missed and its EPS fell short of Wall Street’s estimates. Overall, this was a weaker quarter. The stock remained flat at $60.88 immediately following the results.
So should you invest in Connection right now? We think that the latest quarter is only one piece of the longer-term business quality puzzle. Quality, when combined with valuation, can help determine if the stock is a buy. We cover that in our actionable full research report which you can read here, it’s free for active Edge members.


