

Electrical construction and infrastructure services provider MYR Group (NASDAQ: MYRG) beat Wall Street’s revenue expectations in Q3 CY2025, with sales up 7% year on year to $950.4 million. Its GAAP profit of $2.05 per share was 7.1% above analysts’ consensus estimates.
Is now the time to buy MYR Group? Find out by accessing our full research report, it’s free for active Edge members.
MYR Group (MYRG) Q3 CY2025 Highlights:
- Revenue: $950.4 million vs analyst estimates of $924.7 million (7% year-on-year growth, 2.8% beat)
- EPS (GAAP): $2.05 vs analyst estimates of $1.91 (7.1% beat)
- Adjusted EBITDA: $62.71 million vs analyst estimates of $61.15 million (6.6% margin, 2.6% beat)
- Operating Margin: 4.9%, up from 2.3% in the same quarter last year
- Free Cash Flow Margin: 6.9%, up from 2% in the same quarter last year
- Backlog: $2.66 billion at quarter end, up 2.4% year on year
- Market Capitalization: $3.39 billion
Management CommentsRick Swartz, MYR’s President and CEO, said, “Our third quarter performance resulted in quarterly revenues of $950 million and year-over-year increases in net income, consolidated gross profit, gross margin, and EBITDA.”
Company Overview
Constructing electrical and phone lines in the American Midwest dating back to the 1890s, MYR Group (NASDAQ: MYRG) is a specialty contractor in the electrical construction industry.
Revenue Growth
A company’s long-term sales performance is one signal of its overall quality. Any business can have short-term success, but a top-tier one grows for years. Luckily, MYR Group’s sales grew at a solid 9.7% compounded annual growth rate over the last five years. Its growth beat the average industrials company and shows its offerings resonate with customers.
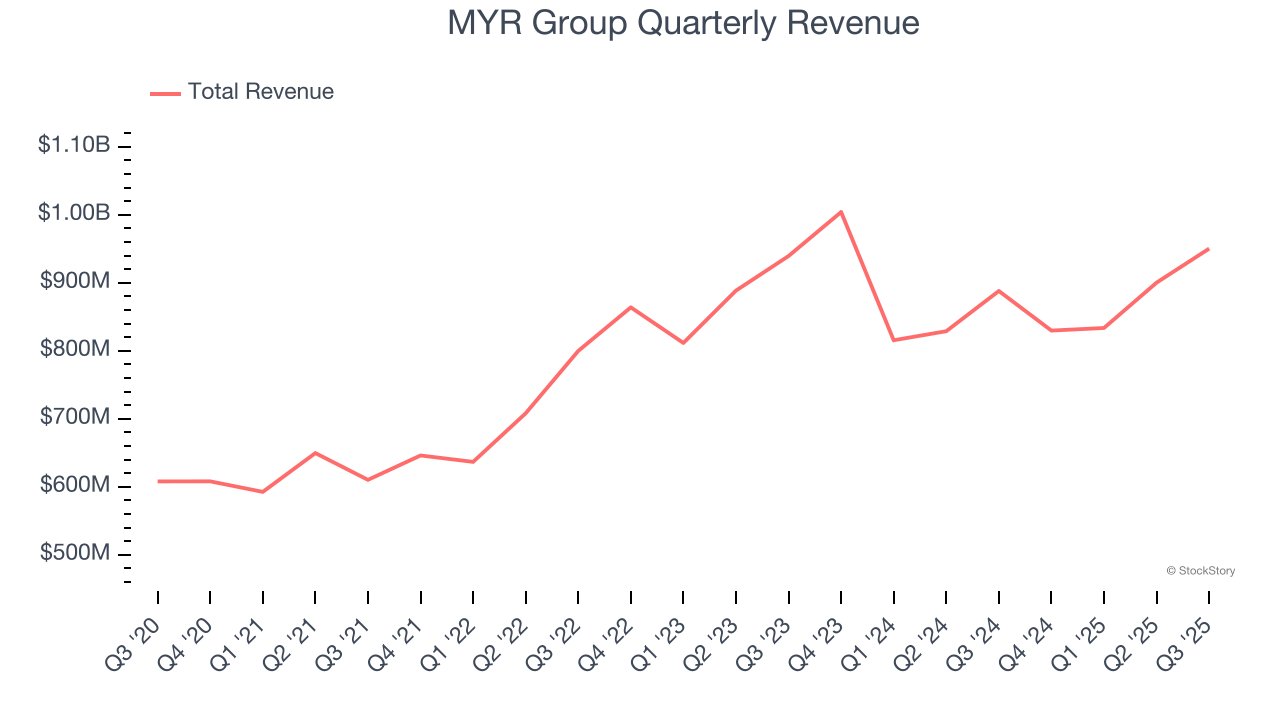
We at StockStory place the most emphasis on long-term growth, but within industrials, a half-decade historical view may miss cycles, industry trends, or a company capitalizing on catalysts such as a new contract win or a successful product line. MYR Group’s recent performance shows its demand has slowed as its revenue was flat over the last two years. 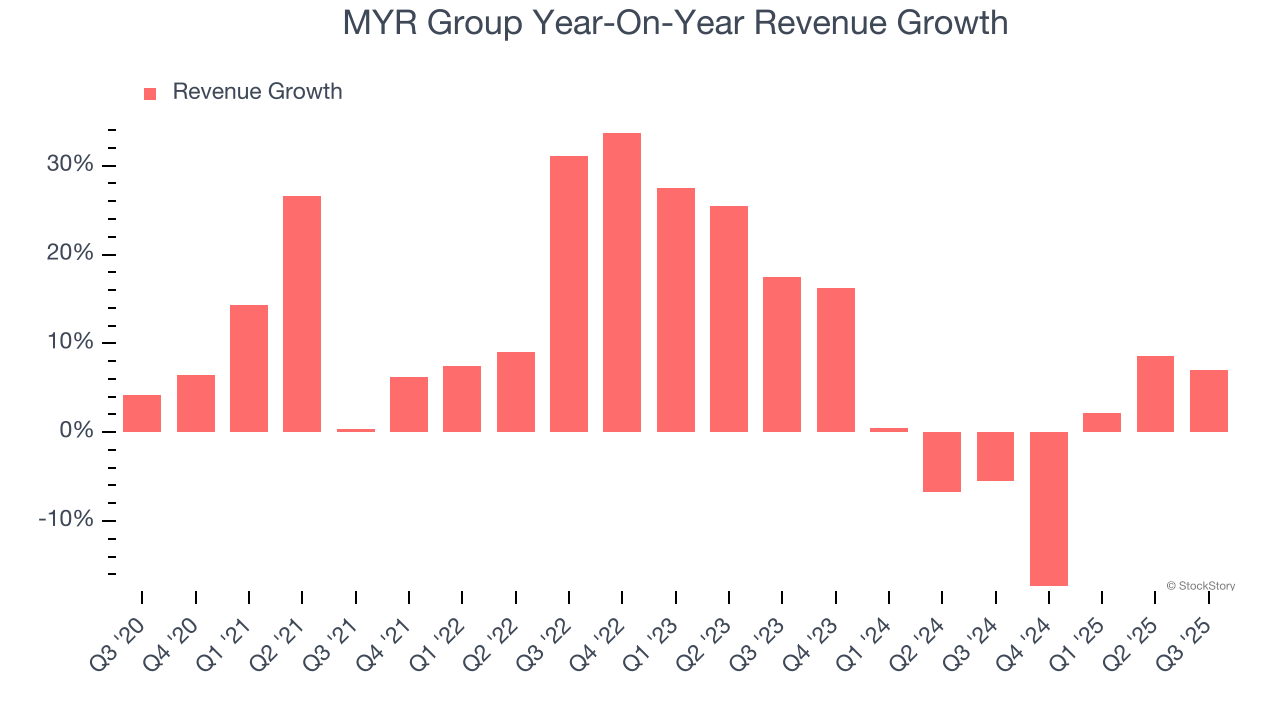
We can better understand the company’s revenue dynamics by analyzing its backlog, or the value of its outstanding orders that have not yet been executed or delivered. MYR Group’s backlog reached $2.66 billion in the latest quarter and averaged 2.8% year-on-year declines over the last two years. Because this number is lower than its revenue growth, we can see the company hasn’t secured enough new orders to maintain its growth rate in the future. 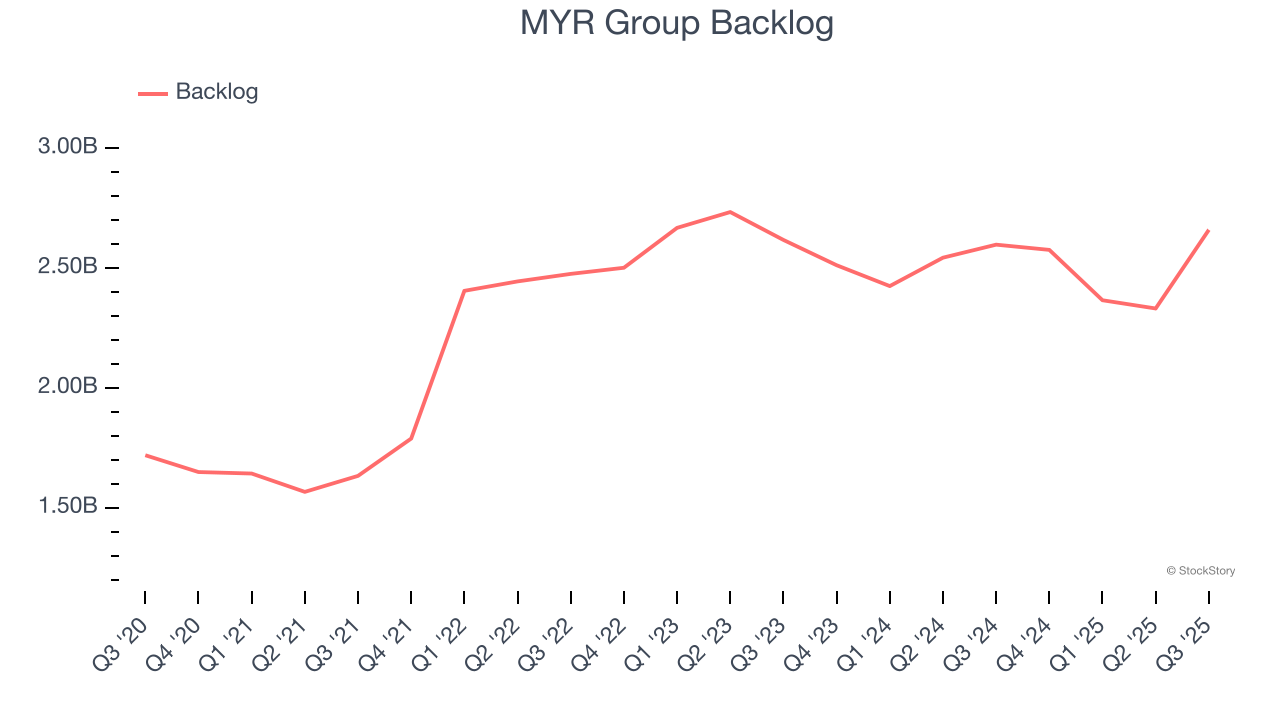
This quarter, MYR Group reported year-on-year revenue growth of 7%, and its $950.4 million of revenue exceeded Wall Street’s estimates by 2.8%.
Looking ahead, sell-side analysts expect revenue to grow 6% over the next 12 months. While this projection indicates its newer products and services will catalyze better top-line performance, it is still below the sector average.
Unless you’ve been living under a rock, it should be obvious by now that generative AI is going to have a huge impact on how large corporations do business. While Nvidia and AMD are trading close to all-time highs, we prefer a lesser-known (but still profitable) stock benefiting from the rise of AI. Click here to access our free report one of our favorites growth stories.
Operating Margin
MYR Group’s operating margin has been trending up over the last 12 months and averaged 3.6% over the last five years. The company’s higher efficiency is a breath of fresh air, but its suboptimal cost structure means it still sports lousy profitability for an industrials business. This result isn’t too surprising given its low gross margin as a starting point.
Analyzing the trend in its profitability, MYR Group’s operating margin might fluctuated slightly but has generally stayed the same over the last five years. This raises questions about the company’s expense base because its revenue growth should have given it leverage on its fixed costs, resulting in better economies of scale and profitability.
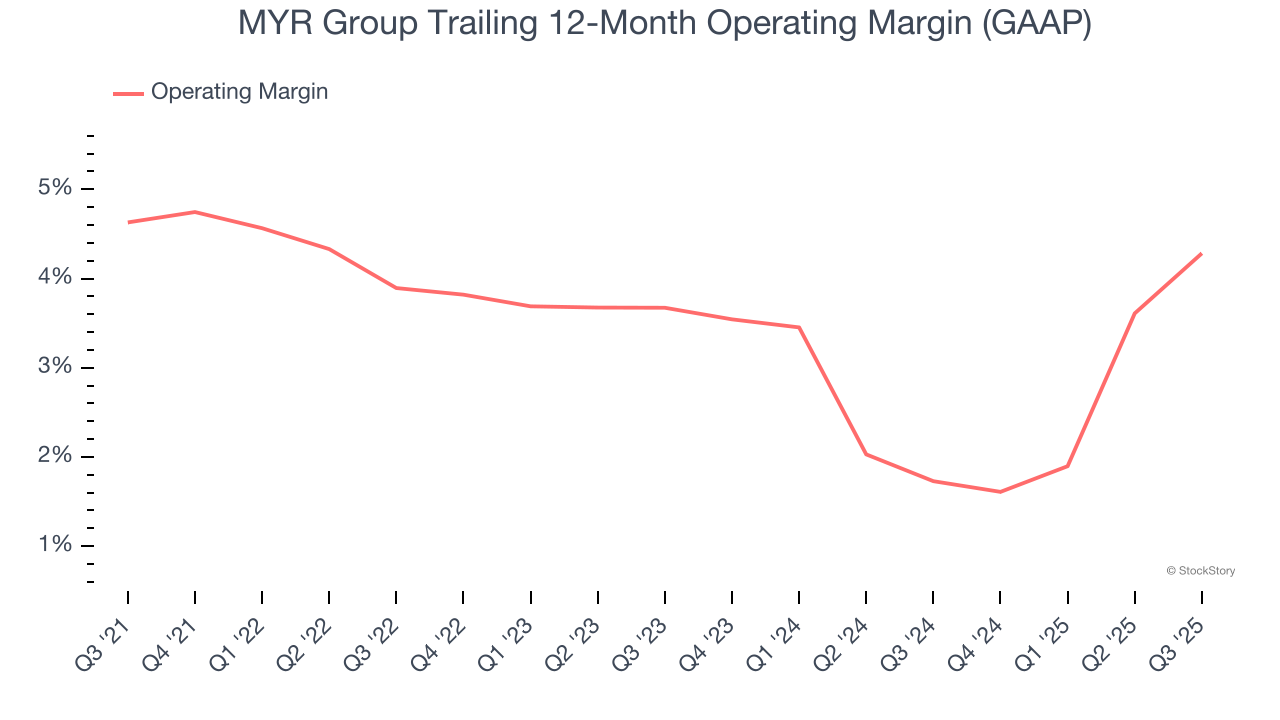
This quarter, MYR Group generated an operating margin profit margin of 4.9%, up 2.6 percentage points year on year. Since its gross margin expanded more than its operating margin, we can infer that leverage on its cost of sales was the primary driver behind the recently higher efficiency.
Earnings Per Share
Revenue trends explain a company’s historical growth, but the long-term change in earnings per share (EPS) points to the profitability of that growth – for example, a company could inflate its sales through excessive spending on advertising and promotions.
MYR Group’s EPS grew at a remarkable 14.2% compounded annual growth rate over the last five years, higher than its 9.7% annualized revenue growth. However, this alone doesn’t tell us much about its business quality because its operating margin didn’t improve.
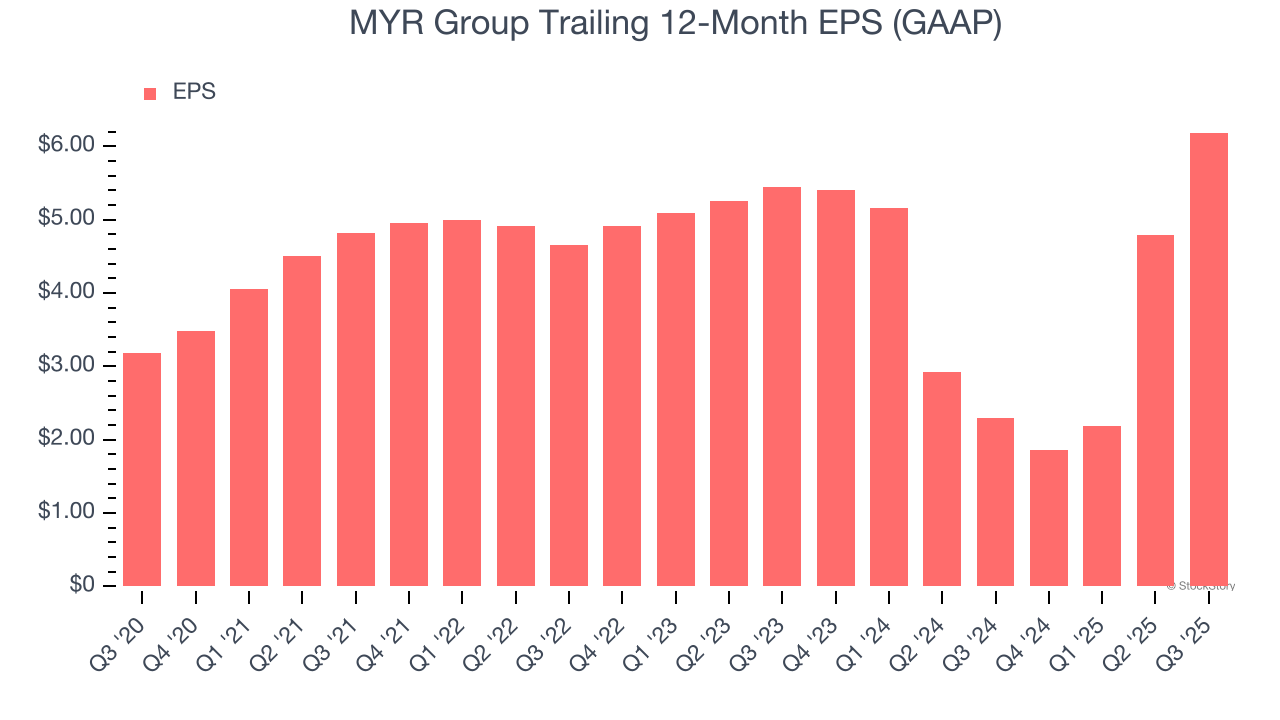
Diving into MYR Group’s quality of earnings can give us a better understanding of its performance. A five-year view shows that MYR Group has repurchased its stock, shrinking its share count by 7.4%. This tells us its EPS outperformed its revenue not because of increased operational efficiency but financial engineering, as buybacks boost per share earnings. 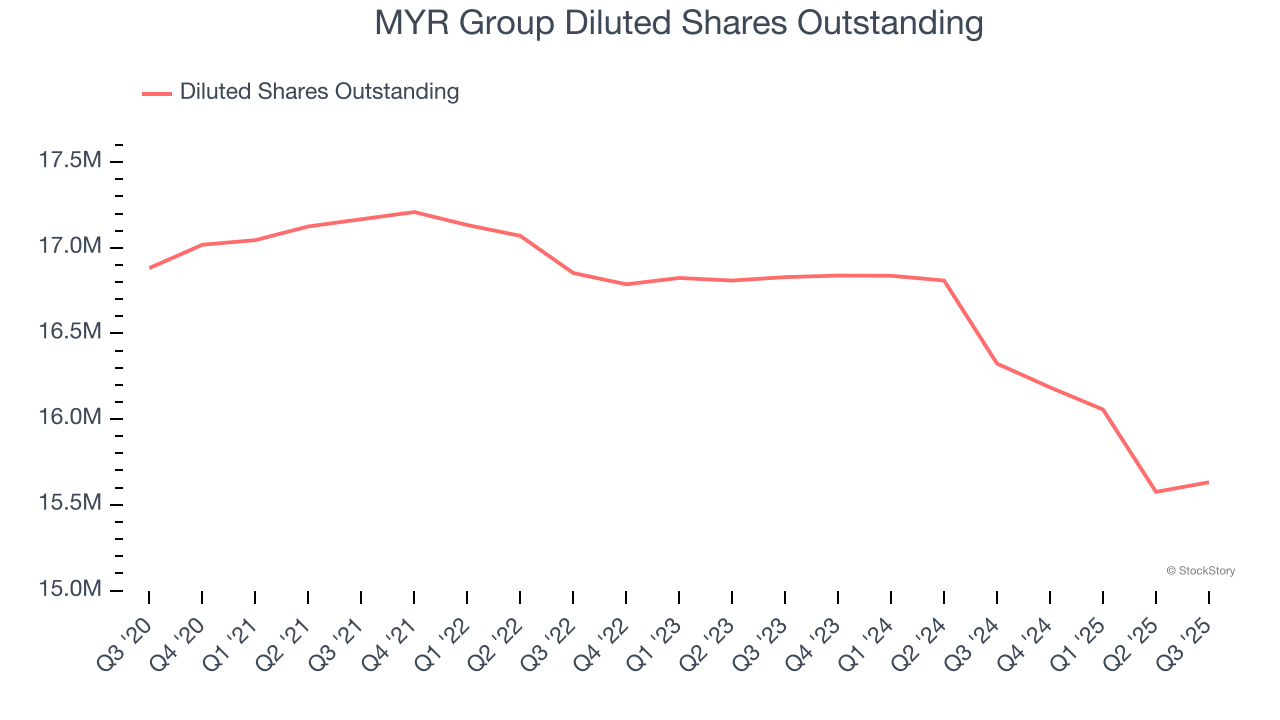
Like with revenue, we analyze EPS over a more recent period because it can provide insight into an emerging theme or development for the business.
For MYR Group, its two-year annual EPS growth of 6.6% was lower than its five-year trend. We hope its growth can accelerate in the future.
In Q3, MYR Group reported EPS of $2.05, up from $0.65 in the same quarter last year. This print beat analysts’ estimates by 7.1%. Over the next 12 months, Wall Street expects MYR Group’s full-year EPS of $6.19 to grow 22.2%.
Key Takeaways from MYR Group’s Q3 Results
We enjoyed seeing MYR Group beat analysts’ revenue expectations this quarter. We were also happy its EPS outperformed Wall Street’s estimates. On the other hand, its backlog was just in line. Overall, this print had some key positives. The stock remained flat at $225.48 immediately after reporting.
So should you invest in MYR Group right now? What happened in the latest quarter matters, but not as much as longer-term business quality and valuation, when deciding whether to invest in this stock. We cover that in our actionable full research report which you can read here, it’s free for active Edge members.


