

Material handling equipment manufacturer Columbus McKinnon (NASDAQ: CMCO) reported Q3 CY2025 results exceeding the market’s revenue expectations, with sales up 7.7% year on year to $261 million. Its non-GAAP profit of $0.62 per share was 17.2% above analysts’ consensus estimates.
Is now the time to buy Columbus McKinnon? Find out by accessing our full research report, it’s free for active Edge members.
Columbus McKinnon (CMCO) Q3 CY2025 Highlights:
- Revenue: $261 million vs analyst estimates of $240.6 million (7.7% year-on-year growth, 8.5% beat)
- Adjusted EPS: $0.62 vs analyst estimates of $0.53 (17.2% beat)
- Adjusted EBITDA: $37.4 million vs analyst estimates of $33.65 million (14.3% margin, 11.1% beat)
- Operating Margin: 4.7%, up from -5.4% in the same quarter last year
- Free Cash Flow Margin: 8.3%, up from 1.6% in the same quarter last year
- Backlog: $351.6 million at quarter end
- Market Capitalization: $427.4 million
"Our team delivered a solid second quarter as the U.S. short-cycle market recovered and we executed on our record backlog," said David J. Wilson, President and Chief Executive Officer.
Company Overview
With 19 different brands across the globe, Columbus McKinnon (NASDAQ: CMCO) offers material handling equipment for the construction, manufacturing, and transportation industries.
Revenue Growth
Reviewing a company’s long-term sales performance reveals insights into its quality. Even a bad business can shine for one or two quarters, but a top-tier one grows for years. Over the last five years, Columbus McKinnon grew its sales at a mediocre 7.4% compounded annual growth rate. This was below our standard for the industrials sector and is a tough starting point for our analysis.
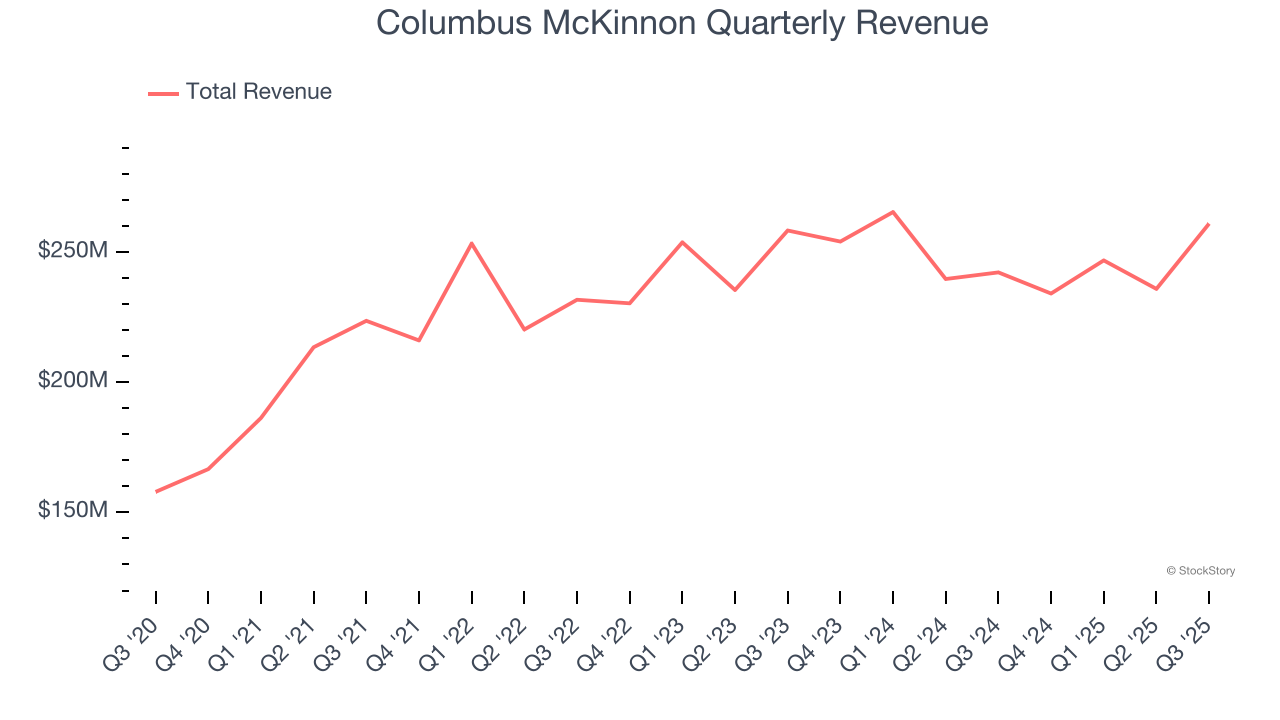
Long-term growth is the most important, but within industrials, a half-decade historical view may miss new industry trends or demand cycles. Columbus McKinnon’s recent performance shows its demand has slowed as its revenue was flat over the last two years. 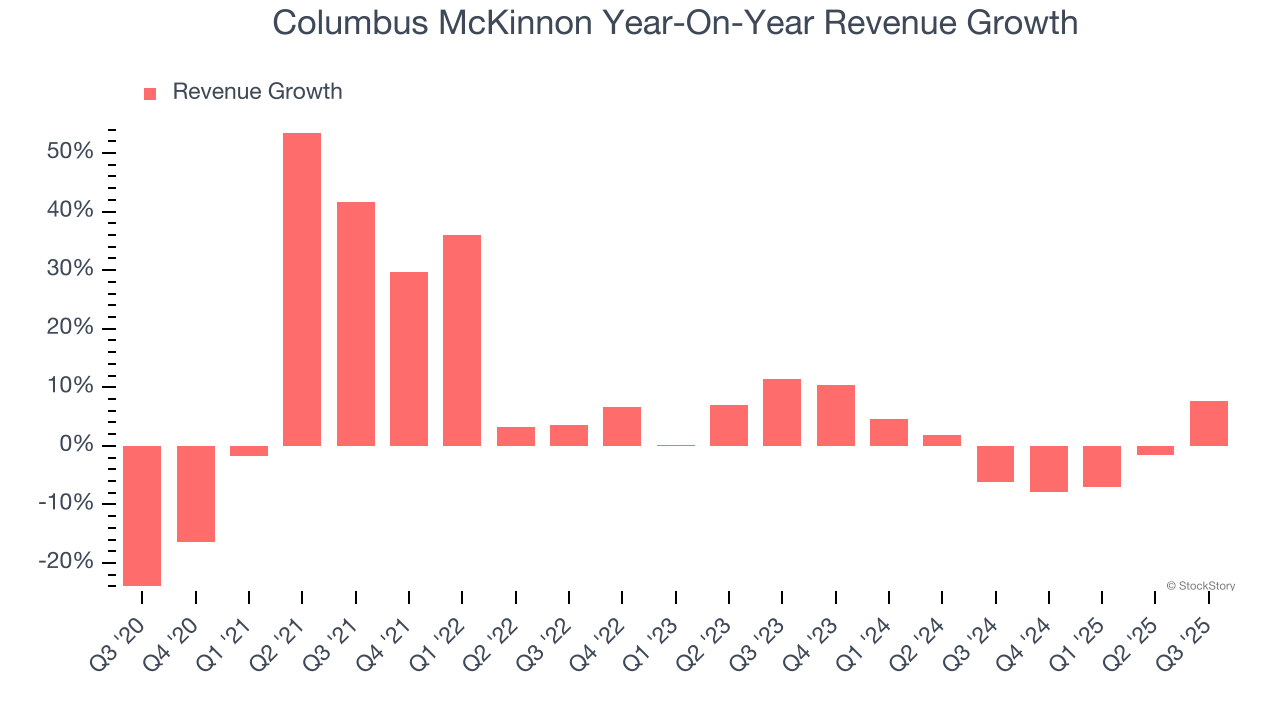
This quarter, Columbus McKinnon reported year-on-year revenue growth of 7.7%, and its $261 million of revenue exceeded Wall Street’s estimates by 8.5%.
Looking ahead, sell-side analysts expect revenue to grow 2% over the next 12 months. Although this projection implies its newer products and services will spur better top-line performance, it is still below the sector average.
Software is eating the world and there is virtually no industry left that has been untouched by it. That drives increasing demand for tools helping software developers do their jobs, whether it be monitoring critical cloud infrastructure, integrating audio and video functionality, or ensuring smooth content streaming. Click here to access a free report on our 3 favorite stocks to play this generational megatrend.
Operating Margin
Columbus McKinnon’s operating margin has been trending up over the last 12 months and averaged 9% over the last five years. Its profitability was higher than the broader industrials sector, showing it did a decent job managing its expenses.
Analyzing the trend in its profitability, Columbus McKinnon’s operating margin might fluctuated slightly but has generally stayed the same over the last five years. This raises questions about the company’s expense base because its revenue growth should have given it leverage on its fixed costs, resulting in better economies of scale and profitability.
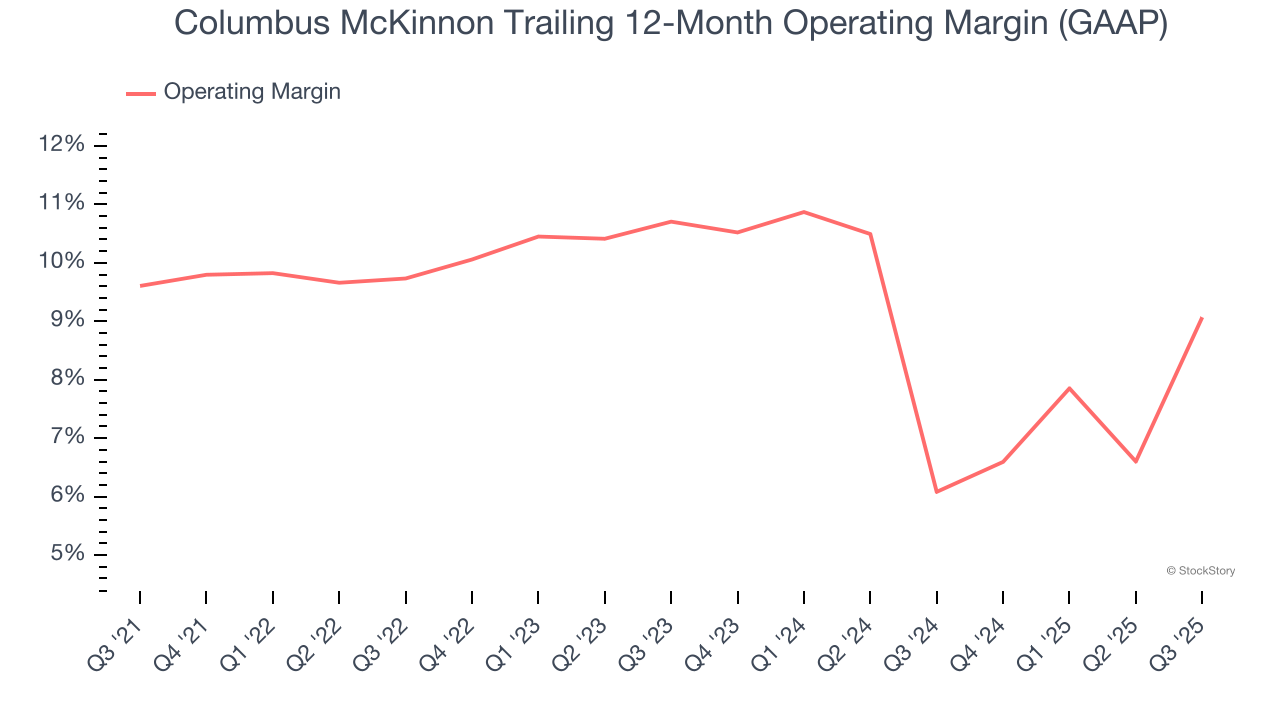
This quarter, Columbus McKinnon generated an operating margin profit margin of 4.7%, up 10.1 percentage points year on year. The increase was solid, and because its operating margin rose more than its gross margin, we can infer it was more efficient with expenses such as marketing, R&D, and administrative overhead.
Earnings Per Share
Revenue trends explain a company’s historical growth, but the long-term change in earnings per share (EPS) points to the profitability of that growth – for example, a company could inflate its sales through excessive spending on advertising and promotions.
Columbus McKinnon’s unimpressive 6.9% annual EPS growth over the last five years aligns with its revenue performance. This tells us it maintained its per-share profitability as it expanded.
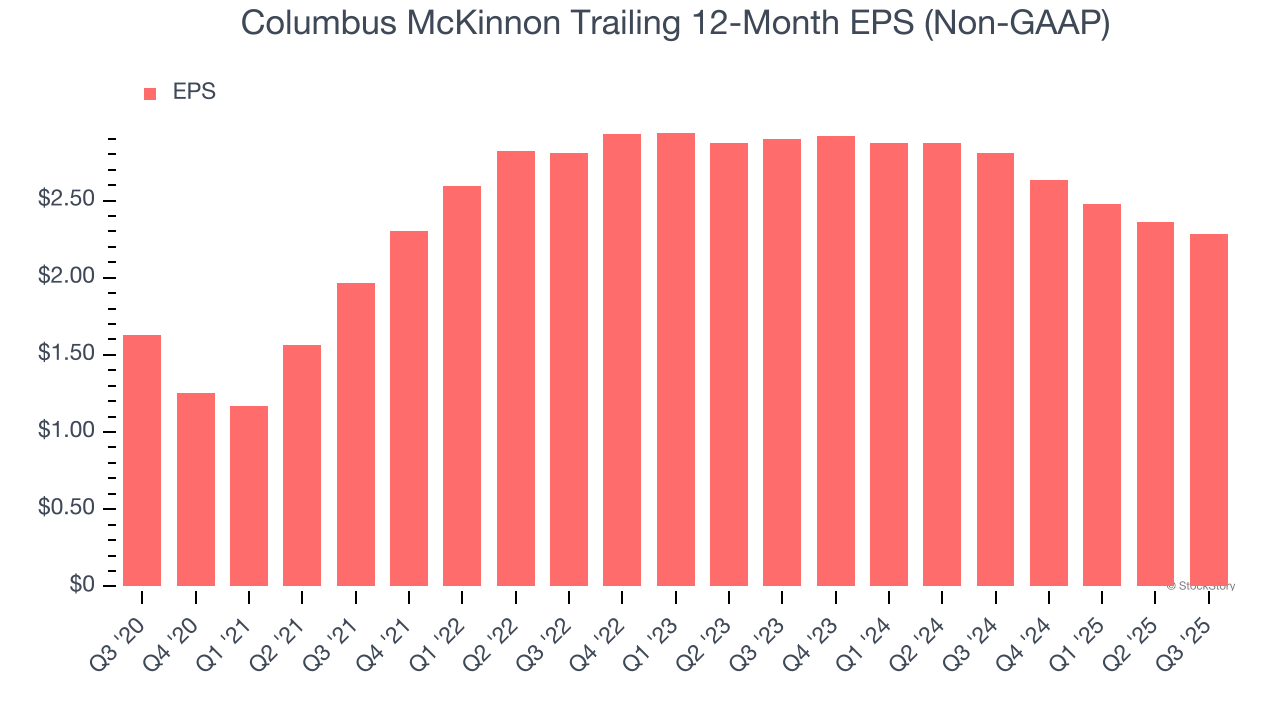
Like with revenue, we analyze EPS over a shorter period to see if we are missing a change in the business.
Columbus McKinnon’s two-year annual EPS declines of 11.3% were bad and lower than its flat revenue.
Diving into the nuances of Columbus McKinnon’s earnings can give us a better understanding of its performance. While we mentioned earlier that Columbus McKinnon’s operating margin expanded this quarter, a two-year view shows its margin has declined. This was the most relevant factor (aside from the revenue impact) behind its lower earnings; interest expenses and taxes can also affect EPS but don’t tell us as much about a company’s fundamentals.
In Q3, Columbus McKinnon reported adjusted EPS of $0.62, down from $0.70 in the same quarter last year. Despite falling year on year, this print easily cleared analysts’ estimates. Over the next 12 months, Wall Street expects Columbus McKinnon’s full-year EPS of $2.28 to grow 19.6%.
Key Takeaways from Columbus McKinnon’s Q3 Results
We were impressed by how significantly Columbus McKinnon blew past analysts’ EBITDA expectations this quarter. We were also excited its revenue outperformed Wall Street’s estimates by a wide margin. Zooming out, we think this was a good print with some key areas of upside. The stock traded up 16.3% to $17.55 immediately following the results.
Columbus McKinnon put up rock-solid earnings, but one quarter doesn’t necessarily make the stock a buy. Let’s see if this is a good investment. What happened in the latest quarter matters, but not as much as longer-term business quality and valuation, when deciding whether to invest in this stock. We cover that in our actionable full research report which you can read here, it’s free for active Edge members.


