Medical technology company Hologic (NASDAQ: HOLX) announced better-than-expected revenue in Q3 CY2025, with sales up 6.2% year on year to $1.05 billion. Its non-GAAP profit of $1.13 per share was 2.7% above analysts’ consensus estimates.
Is now the time to buy Hologic? Find out by accessing our full research report, it’s free for active Edge members.
Hologic (HOLX) Q3 CY2025 Highlights:
- Revenue: $1.05 billion vs analyst estimates of $1.03 billion (6.2% year-on-year growth, 1.5% beat)
- Adjusted EPS: $1.13 vs analyst estimates of $1.10 (2.7% beat)
- Adjusted EBITDA: $347 million vs analyst estimates of $347.1 million (33.1% margin, in line)
- Operating Margin: 22.6%, in line with the same quarter last year
- Free Cash Flow Margin: 32.5%, down from 34.1% in the same quarter last year
- Constant Currency Revenue rose 5.4% year on year (4.2% in the same quarter last year)
- Market Capitalization: $16.45 billion
Company Overview
As a pioneer in 3D mammography technology that has revolutionized breast cancer detection, Hologic (NASDAQ: HOLX) develops and manufactures diagnostic products, medical imaging systems, and surgical devices focused primarily on women's health and wellness.
Revenue Growth
A company’s long-term sales performance is one signal of its overall quality. Even a bad business can shine for one or two quarters, but a top-tier one grows for years. Unfortunately, Hologic’s 1.7% annualized revenue growth over the last five years was tepid. This was below our standards and is a tough starting point for our analysis.
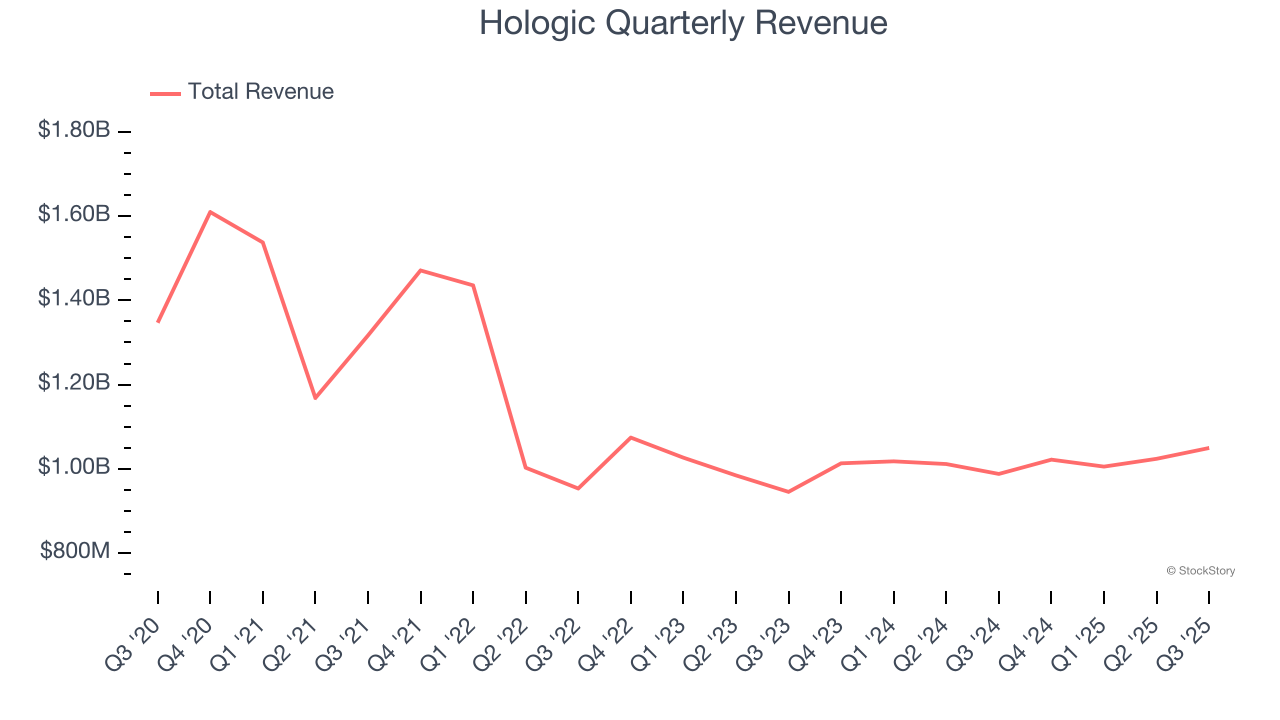
We at StockStory place the most emphasis on long-term growth, but within healthcare, a half-decade historical view may miss recent innovations or disruptive industry trends. Hologic’s recent performance shows its demand has slowed as its revenue was flat over the last two years. 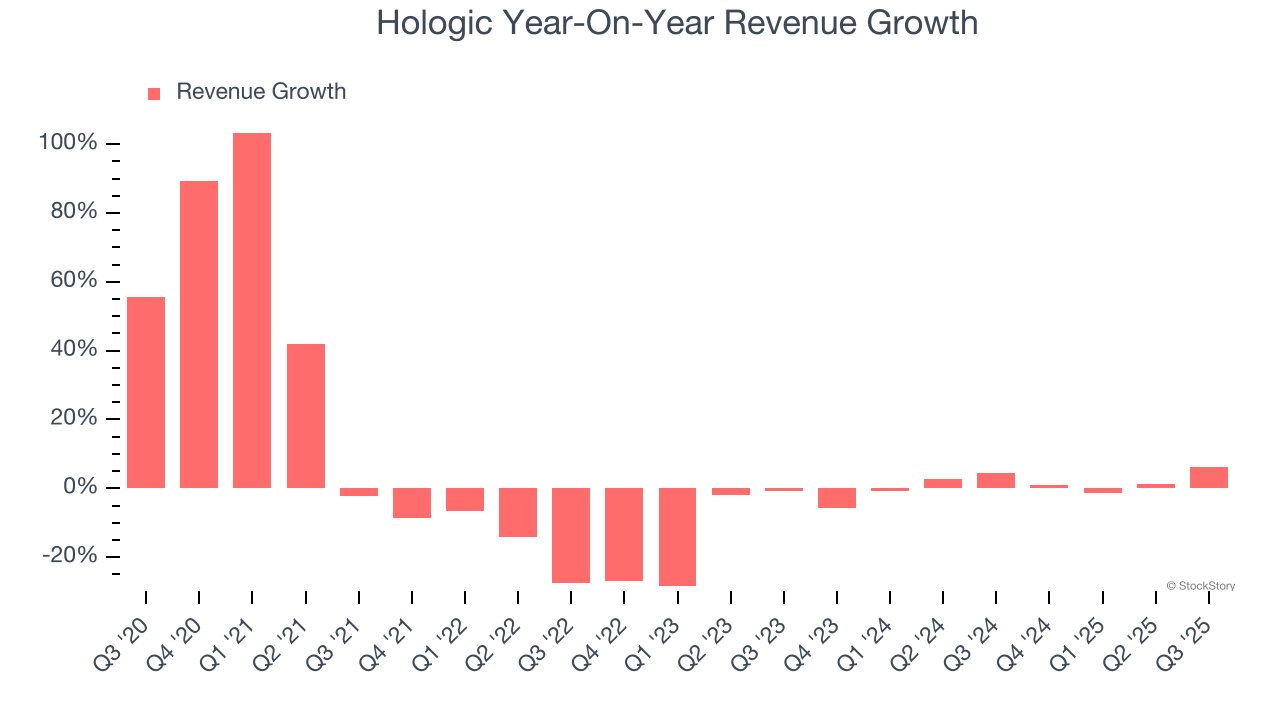
We can better understand the company’s sales dynamics by analyzing its constant currency revenue, which excludes currency movements that are outside their control and not indicative of demand. Over the last two years, its constant currency sales were flat. Because this number aligns with its normal revenue growth, we can see that Hologic has properly hedged its foreign currency exposure. 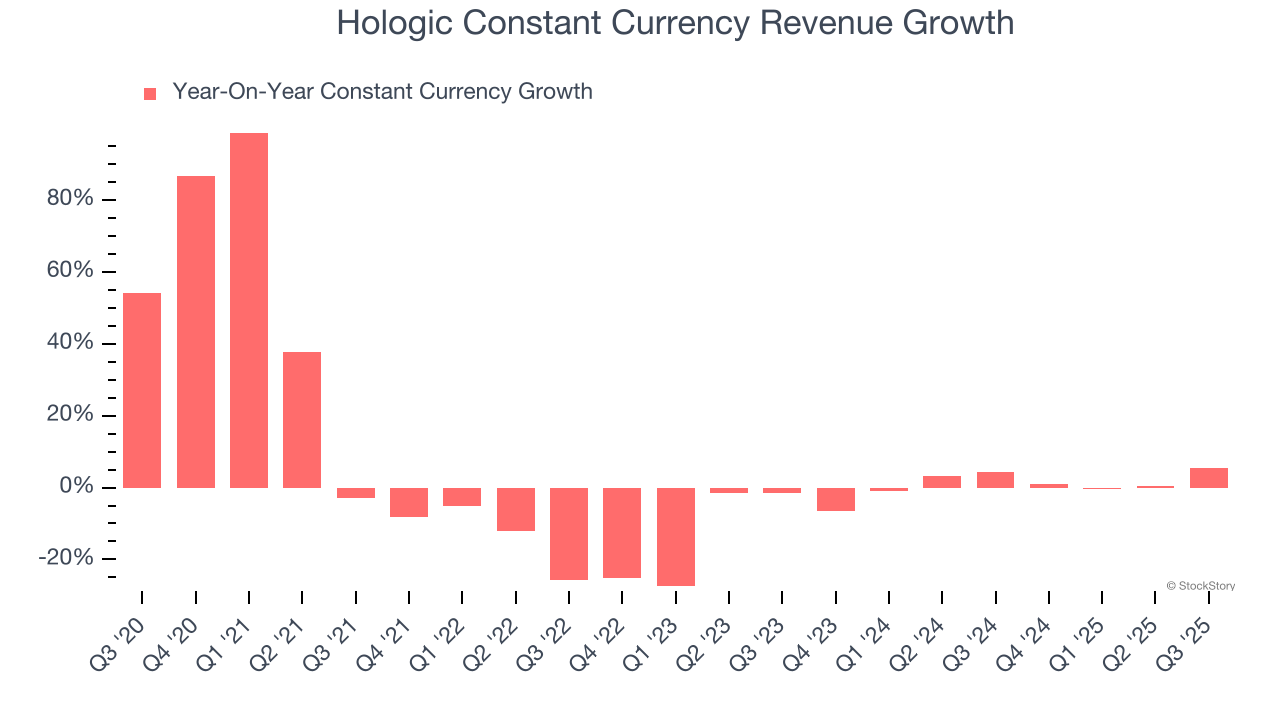
This quarter, Hologic reported year-on-year revenue growth of 6.2%, and its $1.05 billion of revenue exceeded Wall Street’s estimates by 1.5%.
Looking ahead, sell-side analysts expect revenue to grow 4% over the next 12 months. Although this projection implies its newer products and services will spur better top-line performance, it is still below average for the sector.
The 1999 book Gorilla Game predicted Microsoft and Apple would dominate tech before it happened. Its thesis? Identify the platform winners early. Today, enterprise software companies embedding generative AI are becoming the new gorillas. a profitable, fast-growing enterprise software stock that is already riding the automation wave and looking to catch the generative AI next.
Operating Margin
Operating margin is one of the best measures of profitability because it tells us how much money a company takes home after subtracting all core expenses, like marketing and R&D.
Hologic has been an efficient company over the last five years. It was one of the more profitable businesses in the healthcare sector, boasting an average operating margin of 28.2%.
Analyzing the trend in its profitability, Hologic’s operating margin decreased by 26.6 percentage points over the last five years. This raises questions about the company’s expense base because its revenue growth should have given it leverage on its fixed costs, resulting in better economies of scale and profitability.
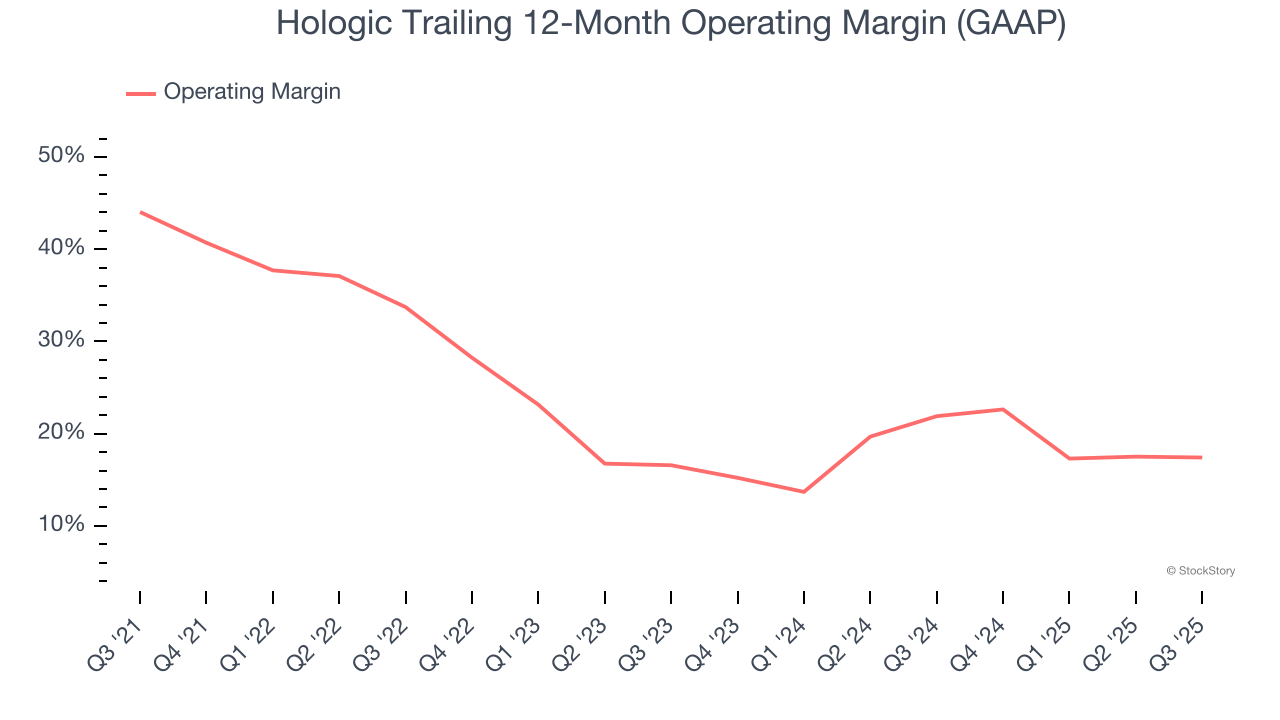
This quarter, Hologic generated an operating margin profit margin of 22.6%, in line with the same quarter last year. This indicates the company’s overall cost structure has been relatively stable.
Earnings Per Share
We track the long-term change in earnings per share (EPS) for the same reason as long-term revenue growth. Compared to revenue, however, EPS highlights whether a company’s growth is profitable.
Hologic’s unimpressive 1.3% annual EPS growth over the last five years aligns with its revenue performance. This tells us it maintained its per-share profitability as it expanded.
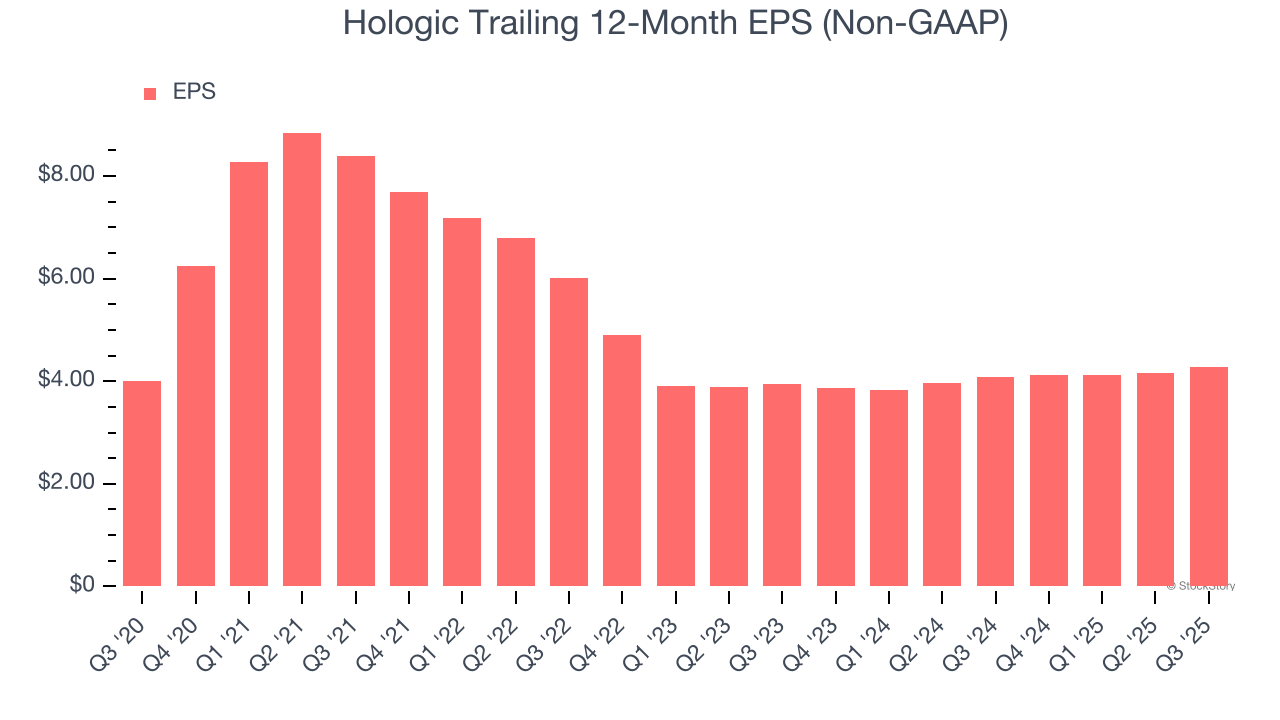
In Q3, Hologic reported adjusted EPS of $1.13, up from $1.01 in the same quarter last year. This print beat analysts’ estimates by 2.7%. Over the next 12 months, Wall Street expects Hologic’s full-year EPS of $4.27 to grow 5.3%.
Key Takeaways from Hologic’s Q3 Results
It was good to see Hologic narrowly top analysts’ constant currency revenue expectations this quarter. We were also happy its revenue outperformed Wall Street’s estimates. Overall, this print had some key positives. The stock remained flat at $73.98 immediately after reporting.
So do we think Hologic is an attractive buy at the current price? We think that the latest quarter is only one piece of the longer-term business quality puzzle. Quality, when combined with valuation, can help determine if the stock is a buy. We cover that in our actionable full research report which you can read here, it’s free for active Edge members.