

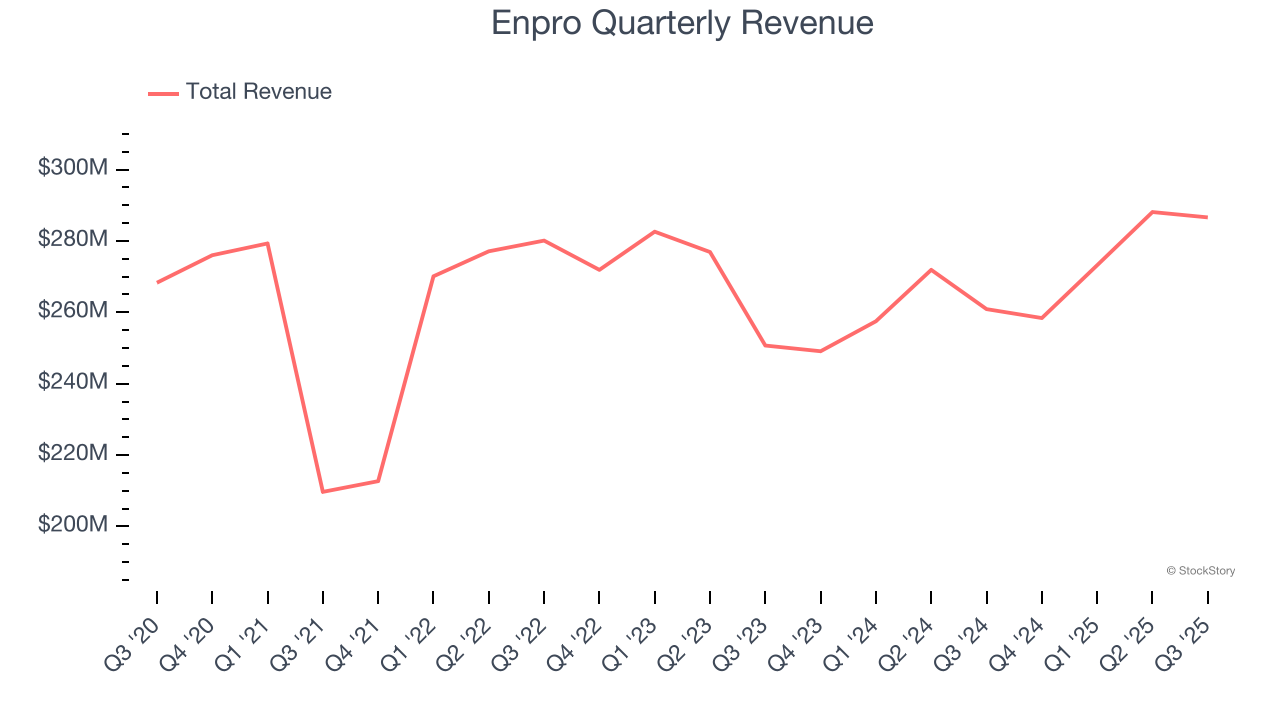
Industrial technology solutions provider EnPro Industries (NYSE: NPO) beat Wall Street’s revenue expectations in Q3 CY2025, with sales up 9.9% year on year to $286.6 million. Its non-GAAP profit of $1.99 per share was 1.7% above analysts’ consensus estimates.
Is now the time to buy Enpro? Find out by accessing our full research report, it’s free for active Edge members.
Enpro (NPO) Q3 CY2025 Highlights:
- Revenue: $286.6 million vs analyst estimates of $276.6 million (9.9% year-on-year growth, 3.6% beat)
- Adjusted EPS: $1.99 vs analyst estimates of $1.96 (1.7% beat)
- Adjusted EBITDA: $69.3 million vs analyst estimates of $68.37 million (24.2% margin, 1.4% beat)
- Management reiterated its full-year Adjusted EPS guidance of $7.85 at the midpoint
- EBITDA guidance for the full year is $275 million at the midpoint, in line with analyst expectations
- Operating Margin: 14.3%, up from 13.2% in the same quarter last year
- Free Cash Flow Margin: 18.2%, similar to the same quarter last year
- Market Capitalization: $4.92 billion
“Enpro delivered another strong quarter with sales growth of almost 10% and solid profitability even as we continue growth investments in capabilities and strategic initiatives that lay the foundation for future value creation," said Eric Vaillancourt, President and Chief Executive Officer.
Company Overview
Holding a Guinness World Record for creating the world's largest gasket, Enpro (NYSE: NPO) designs, manufactures, and sells products used for machinery in various industries.
Revenue Growth
Reviewing a company’s long-term sales performance reveals insights into its quality. Any business can put up a good quarter or two, but the best consistently grow over the long haul. Unfortunately, Enpro struggled to consistently increase demand as its $1.11 billion of sales for the trailing 12 months was close to its revenue five years ago. This was below our standards and is a rough starting point for our analysis.
Long-term growth is the most important, but within industrials, a half-decade historical view may miss new industry trends or demand cycles. Enpro’s annualized revenue growth of 1.1% over the last two years aligns with its five-year trend, suggesting its demand was consistently weak. 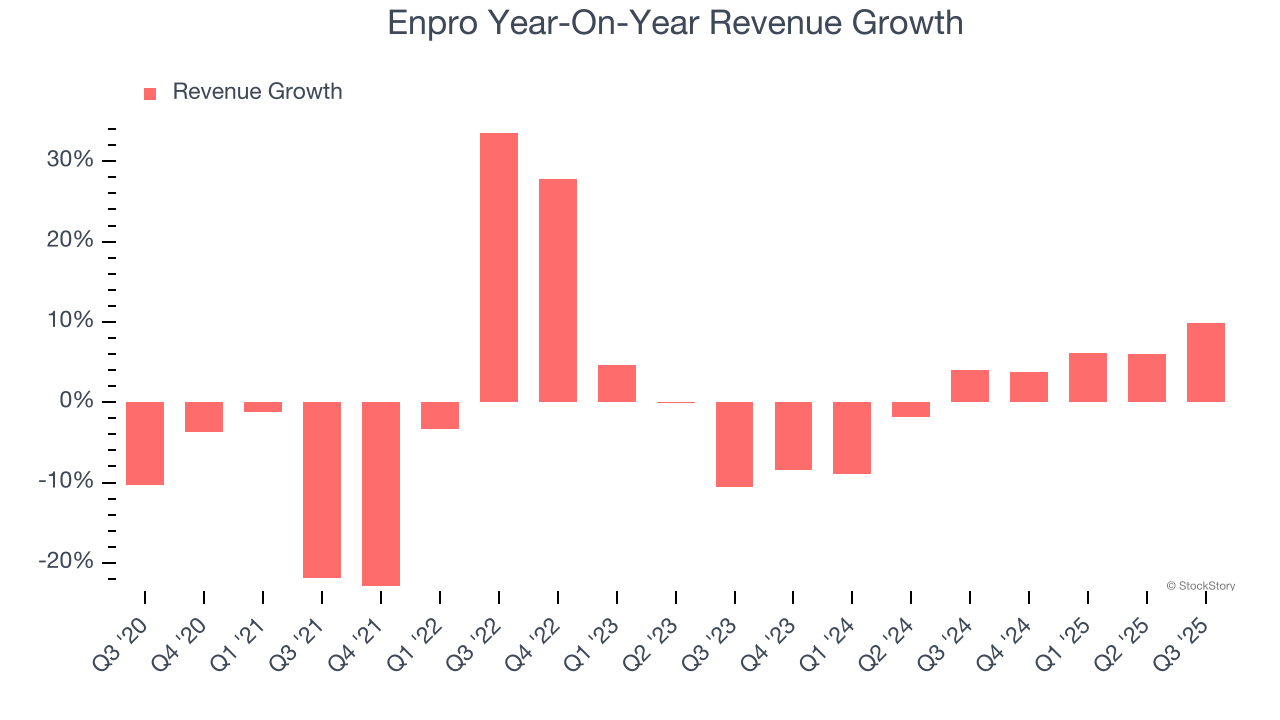
This quarter, Enpro reported year-on-year revenue growth of 9.9%, and its $286.6 million of revenue exceeded Wall Street’s estimates by 3.6%.
Looking ahead, sell-side analysts expect revenue to grow 5.2% over the next 12 months. Although this projection indicates its newer products and services will spur better top-line performance, it is still below the sector average.
The 1999 book Gorilla Game predicted Microsoft and Apple would dominate tech before it happened. Its thesis? Identify the platform winners early. Today, enterprise software companies embedding generative AI are becoming the new gorillas. a profitable, fast-growing enterprise software stock that is already riding the automation wave and looking to catch the generative AI next.
Operating Margin
Enpro has been an efficient company over the last five years. It was one of the more profitable businesses in the industrials sector, boasting an average operating margin of 13.3%. This result isn’t surprising as its high gross margin gives it a favorable starting point.
Analyzing the trend in its profitability, Enpro’s operating margin rose by 4.2 percentage points over the last five years, showing its efficiency has improved.
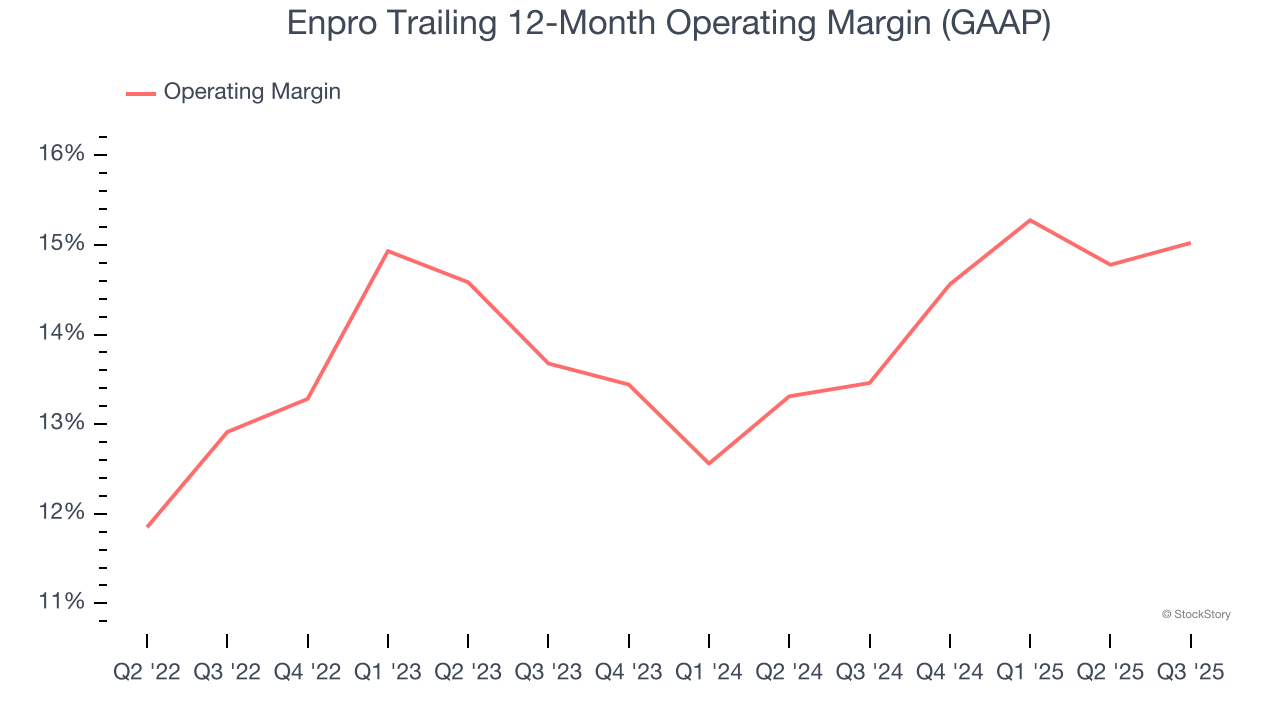
In Q3, Enpro generated an operating margin profit margin of 14.3%, up 1.1 percentage points year on year. The increase was encouraging, and because its operating margin rose more than its gross margin, we can infer it was more efficient with expenses such as marketing, R&D, and administrative overhead.
Earnings Per Share
Revenue trends explain a company’s historical growth, but the long-term change in earnings per share (EPS) points to the profitability of that growth – for example, a company could inflate its sales through excessive spending on advertising and promotions.
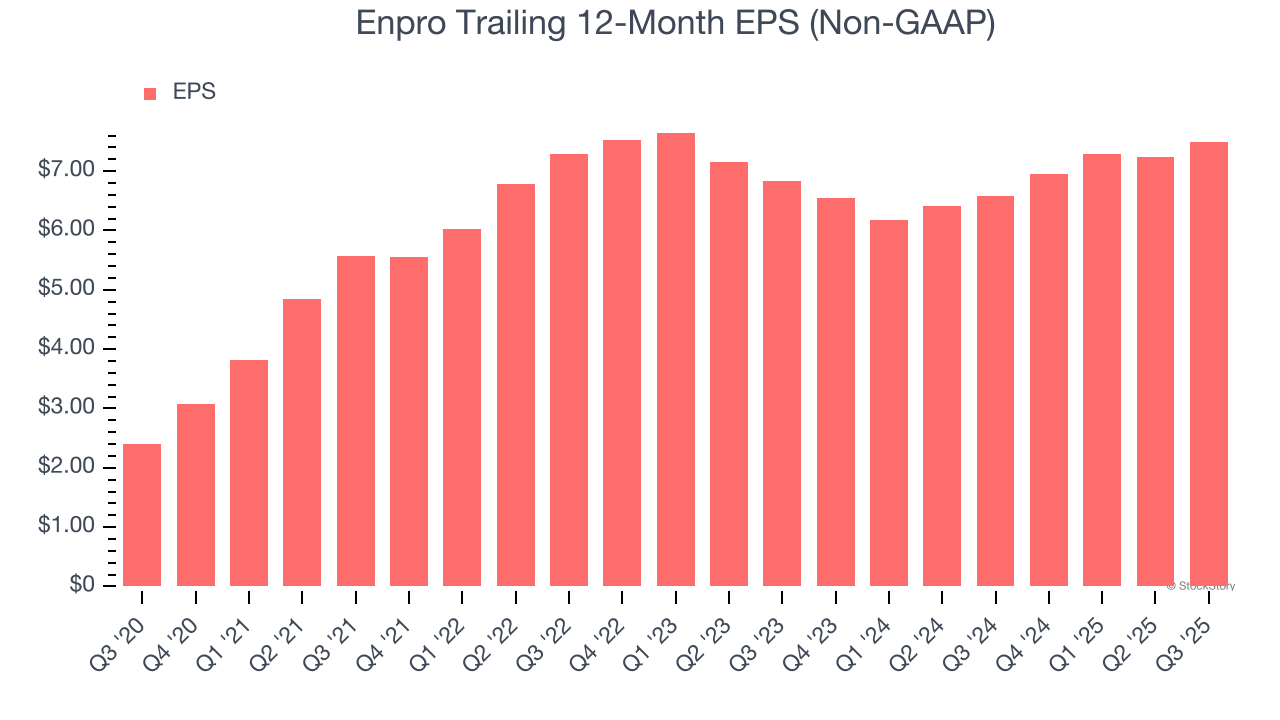
Enpro’s EPS grew at an astounding 25.6% compounded annual growth rate over the last five years, higher than its flat revenue. This tells us management responded to softer demand by adapting its cost structure.
We can take a deeper look into Enpro’s earnings to better understand the drivers of its performance. As we mentioned earlier, Enpro’s operating margin expanded by 4.2 percentage points over the last five years. This was the most relevant factor (aside from the revenue impact) behind its higher earnings; interest expenses and taxes can also affect EPS but don’t tell us as much about a company’s fundamentals.
Like with revenue, we analyze EPS over a shorter period to see if we are missing a change in the business.
For Enpro, its two-year annual EPS growth of 4.7% was lower than its five-year trend. We hope its growth can accelerate in the future.
In Q3, Enpro reported adjusted EPS of $1.99, up from $1.74 in the same quarter last year. This print beat analysts’ estimates by 1.7%. Over the next 12 months, Wall Street expects Enpro’s full-year EPS of $7.49 to grow 16.9%.
Key Takeaways from Enpro’s Q3 Results
We were impressed by how significantly Enpro blew past analysts’ revenue expectations this quarter. We were also glad its full-year EBITDA guidance slightly exceeded Wall Street’s estimates. Overall, we think this was a solid quarter with some key areas of upside. The stock remained flat at $233.87 immediately following the results.
So do we think Enpro is an attractive buy at the current price? When making that decision, it’s important to consider its valuation, business qualities, as well as what has happened in the latest quarter. We cover that in our actionable full research report which you can read here, it’s free for active Edge members.


