

Manufacturing company Stanley Black & Decker (NYSE: SWK) met Wall Streets revenue expectations in Q3 CY2025, but sales were flat year on year at $3.76 billion. Its non-GAAP profit of $1.43 per share was 19.8% above analysts’ consensus estimates.
Is now the time to buy Stanley Black & Decker? Find out by accessing our full research report, it’s free for active Edge members.
Stanley Black & Decker (SWK) Q3 CY2025 Highlights:
- Revenue: $3.76 billion vs analyst estimates of $3.77 billion (flat year on year, in line)
- Adjusted EPS: $1.43 vs analyst estimates of $1.19 (19.8% beat)
- Management lowered its full-year Adjusted EPS guidance to $4.55 at the midpoint, a 2.2% decrease
- Operating Margin: 3.1%, down from 8.6% in the same quarter last year
- Free Cash Flow Margin: 4.1%, down from 5.3% in the same quarter last year
- Organic Revenue fell 1% year on year vs analyst estimates of flat growth (47.7 basis point miss)
- Market Capitalization: $10.27 billion
Christopher J. Nelson, Stanley Black & Decker's President & CEO, commented, "Stanley Black & Decker delivered solid third quarter results, despite prevailing macroeconomic uncertainty. Our performance included continued growth in our DEWALT brand, year over year gross margin expansion and solid free cash flow. The gross margin progress achieved during the third quarter illustrates our rapid and effective response to tariffs and our commitment to achieving our long-term financial objectives.
Company Overview
With an iconic “STANLEY” logo which has remained virtually unchanged for over a century, Stanley Black & Decker (NYSE: SWK) is a manufacturer primarily catering to the tool and outdoor equipment industry.
Revenue Growth
A company’s long-term sales performance is one signal of its overall quality. Any business can have short-term success, but a top-tier one grows for years. Over the last five years, Stanley Black & Decker grew its sales at a sluggish 3.5% compounded annual growth rate. This fell short of our benchmark for the industrials sector and is a rough starting point for our analysis.
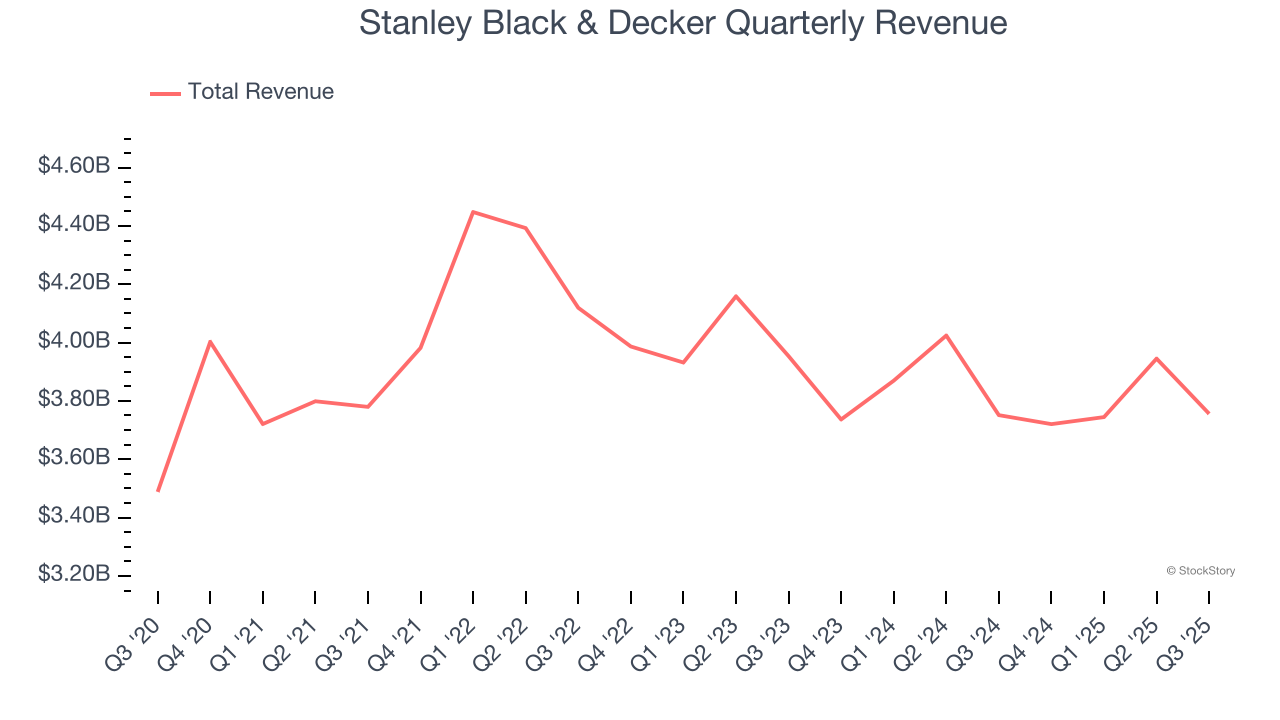
Long-term growth is the most important, but within industrials, a half-decade historical view may miss new industry trends or demand cycles. Stanley Black & Decker’s performance shows it grew in the past but relinquished its gains over the last two years, as its revenue fell by 2.7% annually. 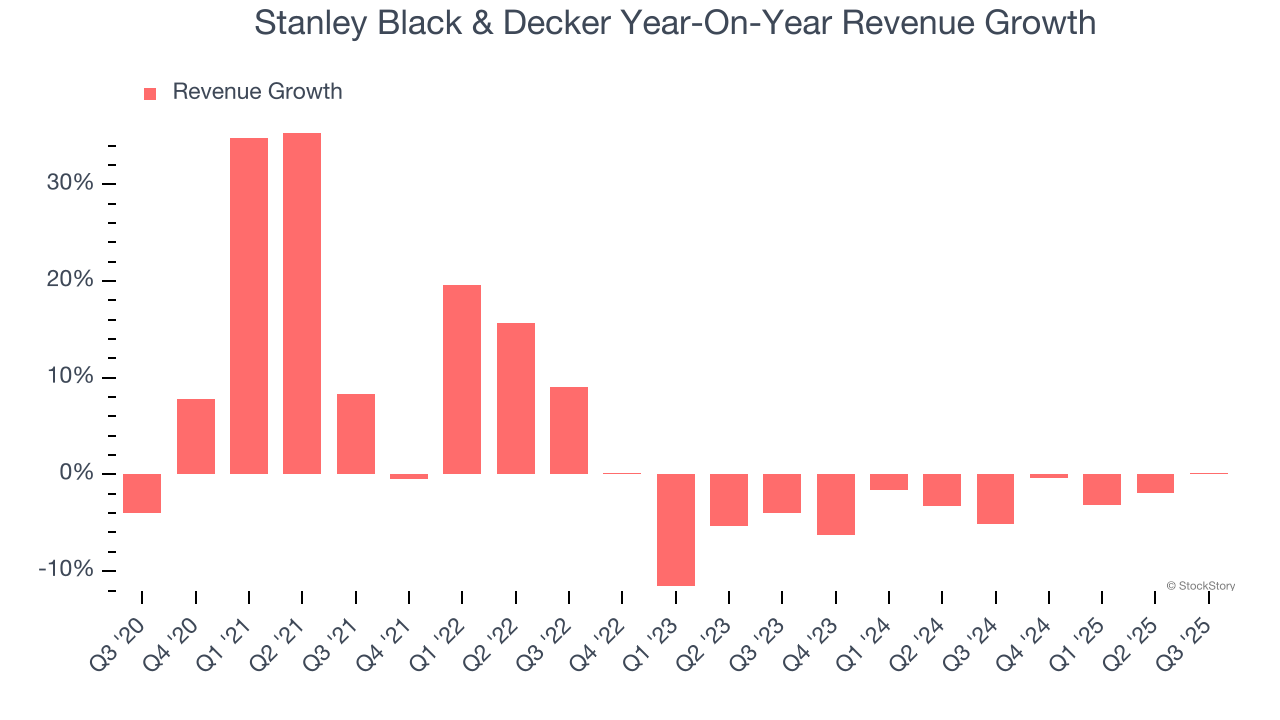
Stanley Black & Decker also reports organic revenue, which strips out one-time events like acquisitions and currency fluctuations that don’t accurately reflect its fundamentals. Over the last two years, Stanley Black & Decker’s organic revenue averaged 1.2% year-on-year declines. Because this number aligns with its two-year revenue growth, we can see the company’s core operations (not acquisitions and divestitures) drove most of its results. 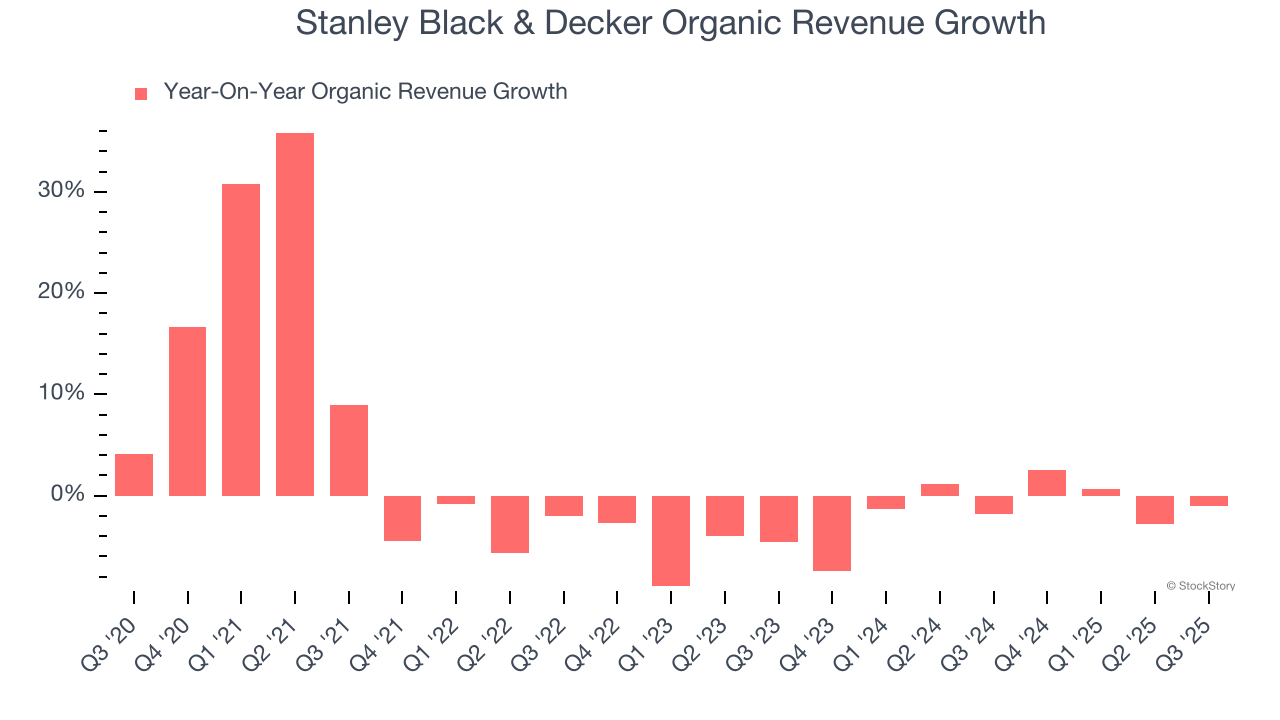
This quarter, Stanley Black & Decker’s $3.76 billion of revenue was flat year on year and in line with Wall Street’s estimates.
Looking ahead, sell-side analysts expect revenue to grow 3.3% over the next 12 months. Although this projection suggests its newer products and services will fuel better top-line performance, it is still below the sector average.
The 1999 book Gorilla Game predicted Microsoft and Apple would dominate tech before it happened. Its thesis? Identify the platform winners early. Today, enterprise software companies embedding generative AI are becoming the new gorillas. a profitable, fast-growing enterprise software stock that is already riding the automation wave and looking to catch the generative AI next.
Operating Margin
Stanley Black & Decker was profitable over the last five years but held back by its large cost base. Its average operating margin of 7.4% was weak for an industrials business. This result isn’t too surprising given its low gross margin as a starting point.
Analyzing the trend in its profitability, Stanley Black & Decker’s operating margin decreased by 9.8 percentage points over the last five years. This raises questions about the company’s expense base because its revenue growth should have given it leverage on its fixed costs, resulting in better economies of scale and profitability. Stanley Black & Decker’s performance was poor no matter how you look at it - it shows that costs were rising and it couldn’t pass them onto its customers.
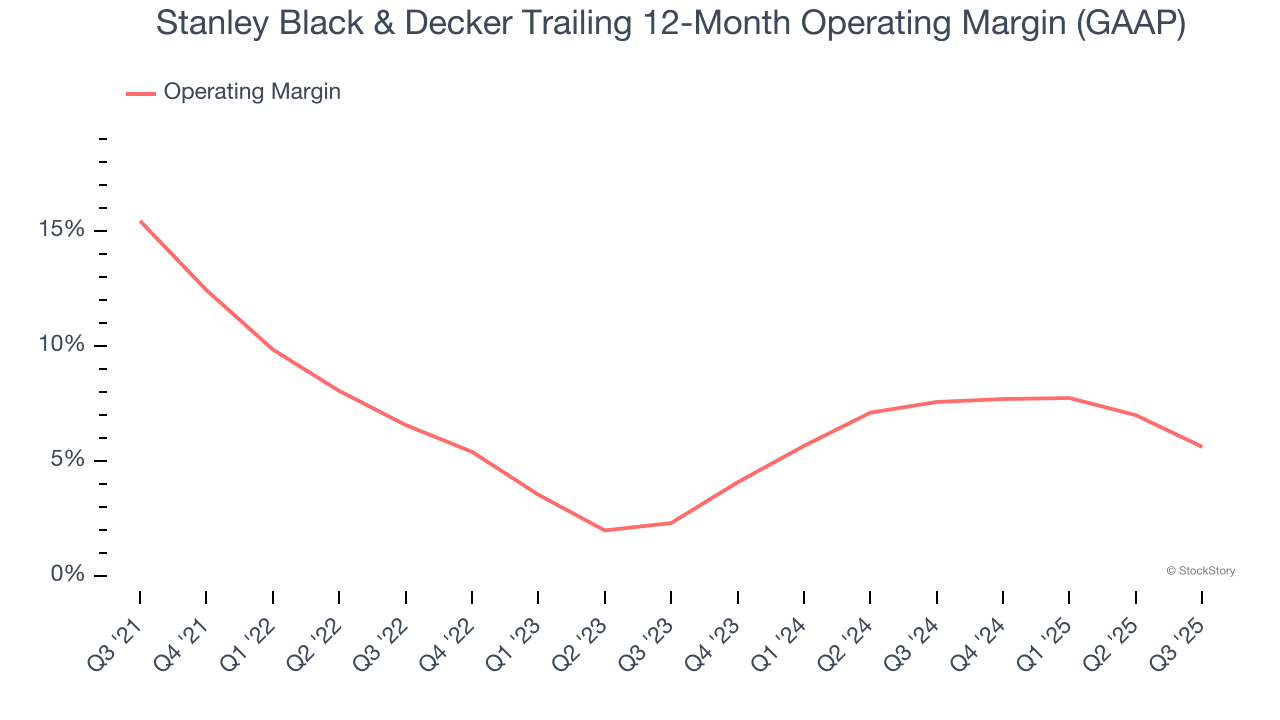
In Q3, Stanley Black & Decker generated an operating margin profit margin of 3.1%, down 5.6 percentage points year on year. Since Stanley Black & Decker’s operating margin decreased more than its gross margin, we can assume it was less efficient because expenses such as marketing, R&D, and administrative overhead increased.
Earnings Per Share
Revenue trends explain a company’s historical growth, but the long-term change in earnings per share (EPS) points to the profitability of that growth – for example, a company could inflate its sales through excessive spending on advertising and promotions.
Sadly for Stanley Black & Decker, its EPS declined by 9.6% annually over the last five years while its revenue grew by 3.5%. This tells us the company became less profitable on a per-share basis as it expanded due to non-fundamental factors such as interest expenses and taxes.
We can take a deeper look into Stanley Black & Decker’s earnings to better understand the drivers of its performance. As we mentioned earlier, Stanley Black & Decker’s operating margin declined by 9.8 percentage points over the last five years. This was the most relevant factor (aside from the revenue impact) behind its lower earnings; interest expenses and taxes can also affect EPS but don’t tell us as much about a company’s fundamentals.
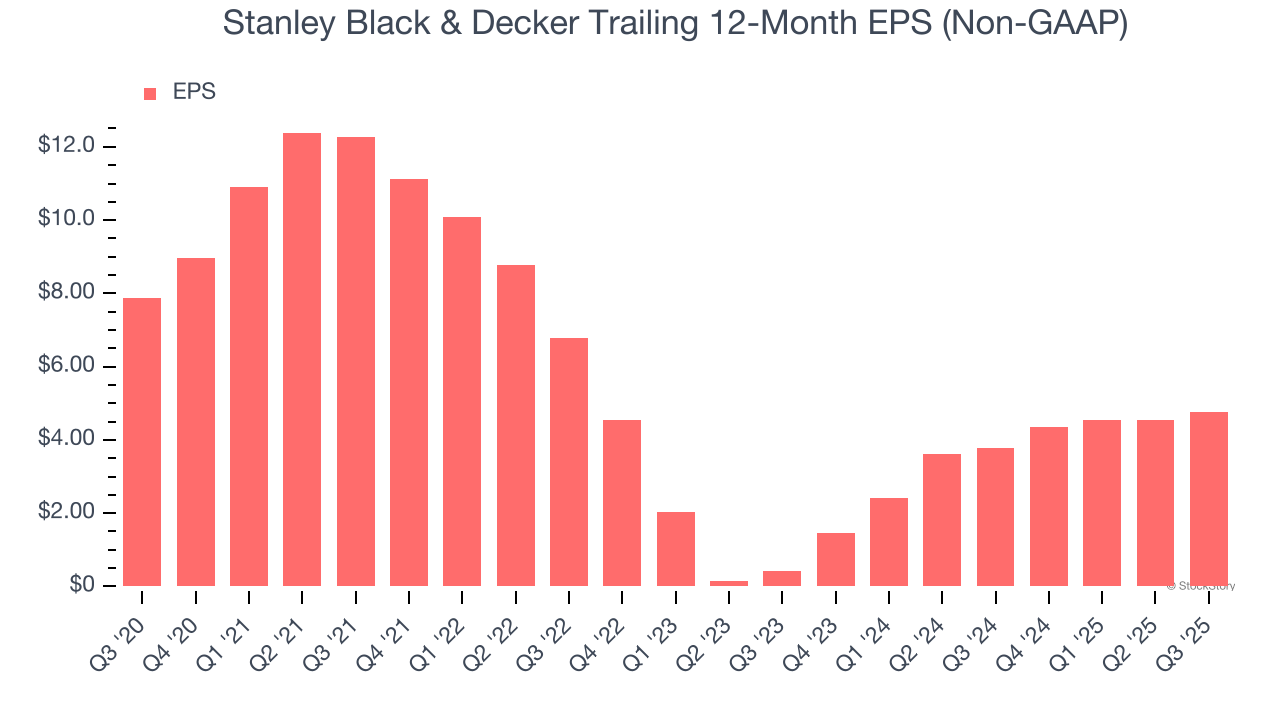
Like with revenue, we analyze EPS over a shorter period to see if we are missing a change in the business.
For Stanley Black & Decker, its two-year annual EPS growth of 232% was higher than its five-year trend. This acceleration made it one of the faster-growing industrials companies in recent history.
In Q3, Stanley Black & Decker reported adjusted EPS of $1.43, up from $1.22 in the same quarter last year. This print easily cleared analysts’ estimates, and shareholders should be content with the results. Over the next 12 months, Wall Street expects Stanley Black & Decker’s full-year EPS of $4.75 to grow 15.6%.
Key Takeaways from Stanley Black & Decker’s Q3 Results
It was good to see Stanley Black & Decker beat analysts’ EPS expectations this quarter. On the other hand, its revenue was just in line and full-year EPS guidance missed Wall Street’s estimates. Overall, this quarter could have been better. The stock traded down 2.8% to $64.49 immediately following the results.
Big picture, is Stanley Black & Decker a buy here and now? If you’re making that decision, you should consider the bigger picture of valuation, business qualities, as well as the latest earnings. We cover that in our actionable full research report which you can read here, it’s free for active Edge members.


