

Facility services provider ABM Industries (NYSE: ABM) reported Q3 CY2025 results exceeding the market’s revenue expectations, with sales up 5.4% year on year to $2.30 billion. Its non-GAAP profit of $0.88 per share was 19% below analysts’ consensus estimates.
Is now the time to buy ABM? Find out by accessing our full research report, it’s free for active Edge members.
ABM (ABM) Q3 CY2025 Highlights:
- Revenue: $2.30 billion vs analyst estimates of $2.27 billion (5.4% year-on-year growth, 1% beat)
- Adjusted EPS: $0.88 vs analyst expectations of $1.09 (19% miss)
- Adjusted EBITDA: $124.2 million vs analyst estimates of $148.6 million (5.4% margin, 16.4% miss)
- Adjusted EPS guidance for the upcoming financial year 2026 is $4 at the midpoint, missing analyst estimates by 0.5%
- Operating Margin: 3%, up from 0.9% in the same quarter last year
- Free Cash Flow Margin: 4.9%, up from 0.7% in the same quarter last year
- Organic Revenue rose 4.8% year on year vs analyst estimates of 4.3% growth (49.2 basis point beat)
- Market Capitalization: $2.80 billion
“ABM finished the year on a high note with record quarterly revenue, supported by 4.8% organic growth. Excluding prior year self-insurance adjustments, fourth quarter adjusted EPS, adjusted EBITDA and adjusted EBITDA margin all exceeded our expectations, reflecting strong volume, favorable mix, and the benefits of our cost discipline and restructuring actions. Our performance was led by exceptional results in Technical Solutions, where the team successfully delivered numerous projects in a complex construction environment. Aviation and Manufacturing & Distribution also posted strong revenue growth, each benefiting from recent client wins and customer expansions, while Business & Industry and Education generated improved margins, demonstrating the resiliency of their end markets and continued focus on operational efficiency," said Scott Salmirs, President and Chief Executive Officer.
Company Overview
With roots dating back to 1909 as a window washing company, ABM Industries (NYSE: ABM) provides integrated facility management, infrastructure, and mobility solutions across various sectors including commercial, manufacturing, education, and aviation.
Revenue Growth
A company’s long-term sales performance can indicate its overall quality. Any business can put up a good quarter or two, but many enduring ones grow for years.
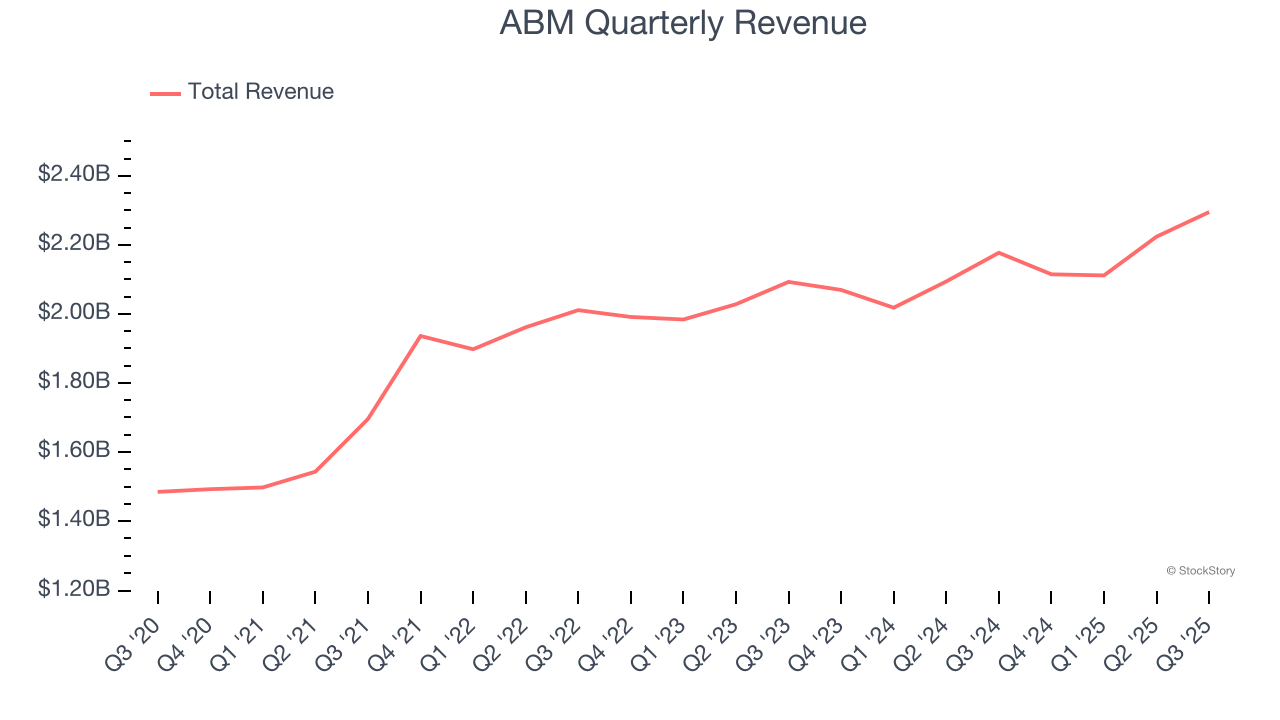
With $8.75 billion in revenue over the past 12 months, ABM is one of the larger companies in the business services industry and benefits from a well-known brand that influences purchasing decisions.
As you can see below, ABM’s sales grew at a solid 7.9% compounded annual growth rate over the last five years. This shows it had high demand, a useful starting point for our analysis.
We at StockStory place the most emphasis on long-term growth, but within business services, a half-decade historical view may miss recent innovations or disruptive industry trends. ABM’s recent performance shows its demand has slowed as its annualized revenue growth of 3.9% over the last two years was below its five-year trend. 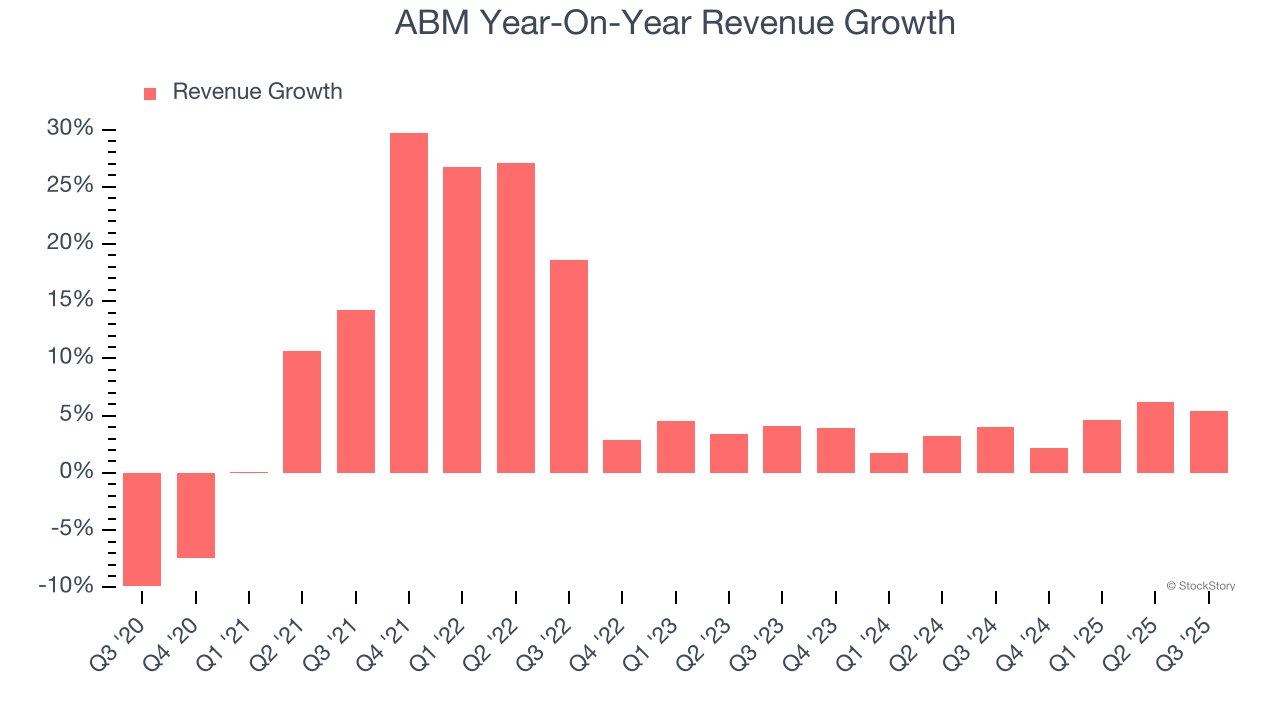
We can dig further into the company’s sales dynamics by analyzing its organic revenue, which strips out one-time events like acquisitions and currency fluctuations that don’t accurately reflect its fundamentals. Over the last two years, ABM’s organic revenue averaged 3.4% year-on-year growth. Because this number aligns with its two-year revenue growth, we can see the company’s core operations (not acquisitions and divestitures) drove most of its results. 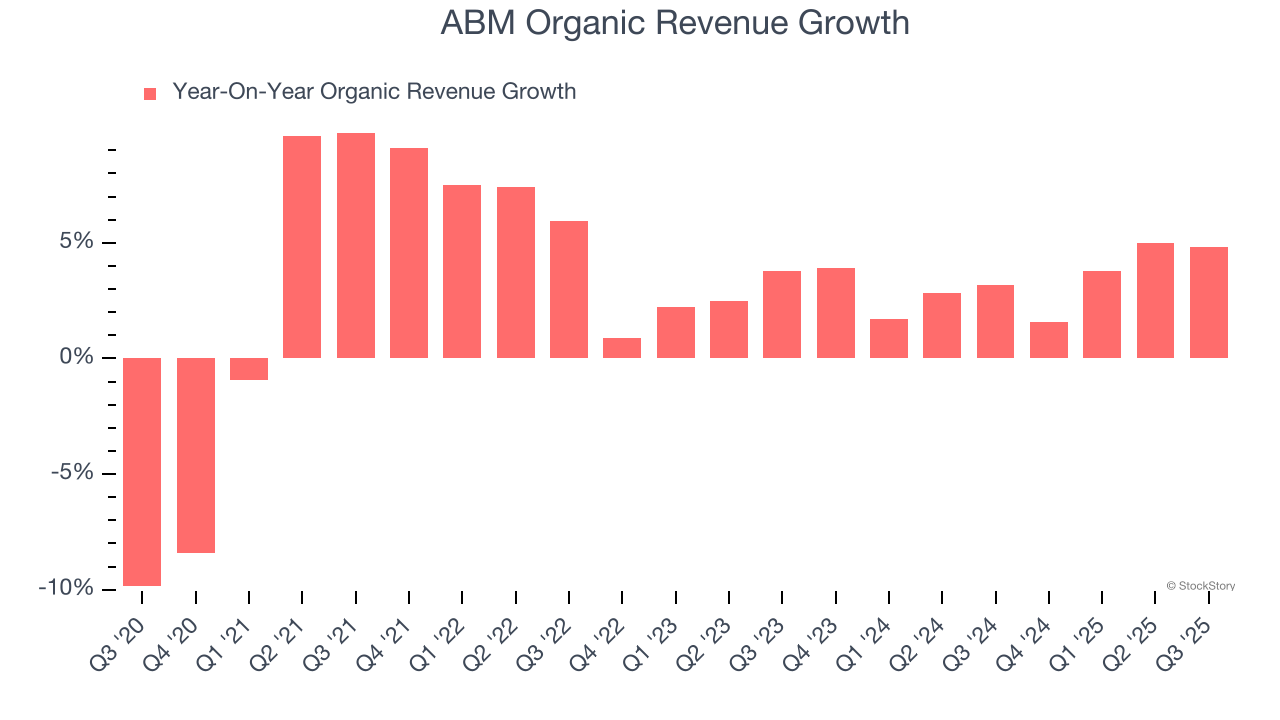
This quarter, ABM reported year-on-year revenue growth of 5.4%, and its $2.30 billion of revenue exceeded Wall Street’s estimates by 1%.
Looking ahead, sell-side analysts expect revenue to grow 2.8% over the next 12 months, similar to its two-year rate. This projection is underwhelming and implies its products and services will face some demand challenges.
Microsoft, Alphabet, Coca-Cola, Monster Beverage—all began as under-the-radar growth stories riding a massive trend. We’ve identified the next one: a profitable AI semiconductor play Wall Street is still overlooking. Go here for access to our full report.
Operating Margin
Operating margin is one of the best measures of profitability because it tells us how much money a company takes home after subtracting all core expenses, like marketing and R&D.
ABM’s operating margin has risen over the last 12 months and averaged 3.8% over the last five years. The company’s higher efficiency is a breath of fresh air, but its suboptimal cost structure means it still sports lousy profitability for a business services business.
Analyzing the trend in its profitability, ABM’s operating margin might fluctuated slightly but has generally stayed the same over the last five years. This raises questions about the company’s expense base because its revenue growth should have given it leverage on its fixed costs, resulting in better economies of scale and profitability.
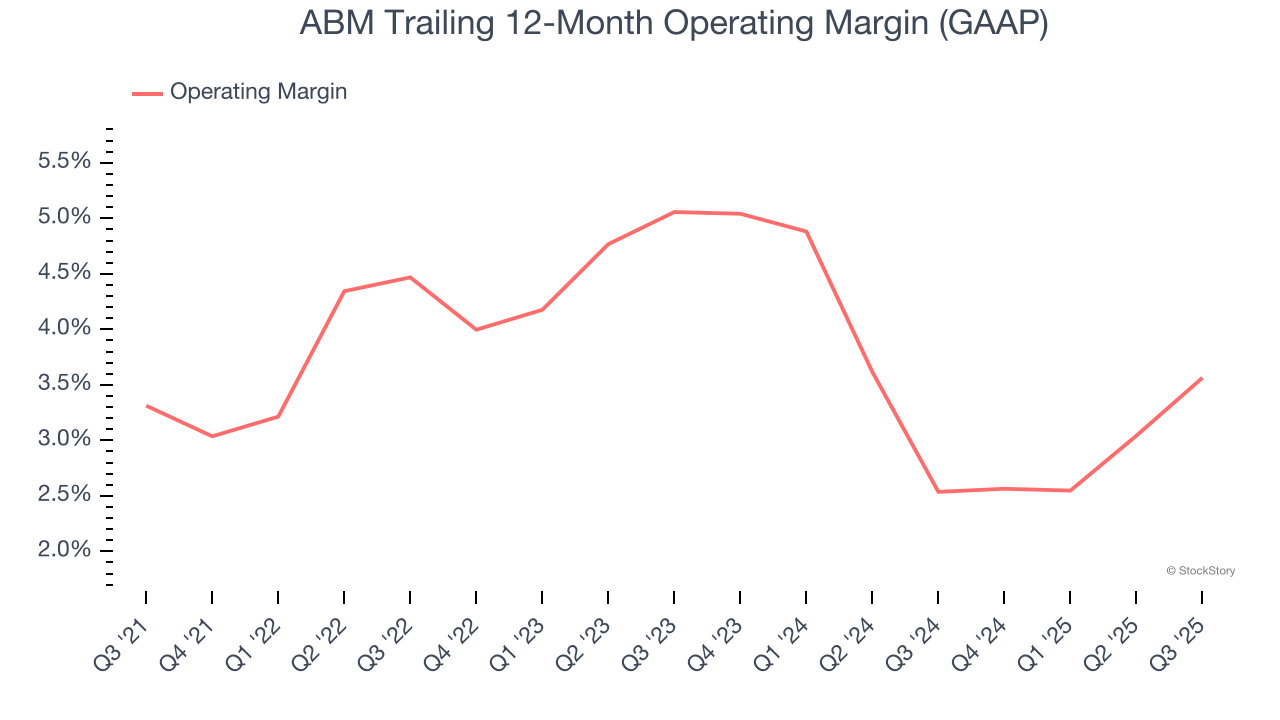
This quarter, ABM generated an operating margin profit margin of 3%, up 2.1 percentage points year on year. This increase was a welcome development and shows it was more efficient.
Earnings Per Share
We track the long-term change in earnings per share (EPS) for the same reason as long-term revenue growth. Compared to revenue, however, EPS highlights whether a company’s growth is profitable.
ABM’s unimpressive 7.1% annual EPS growth over the last five years aligns with its revenue performance. This tells us it maintained its per-share profitability as it expanded.
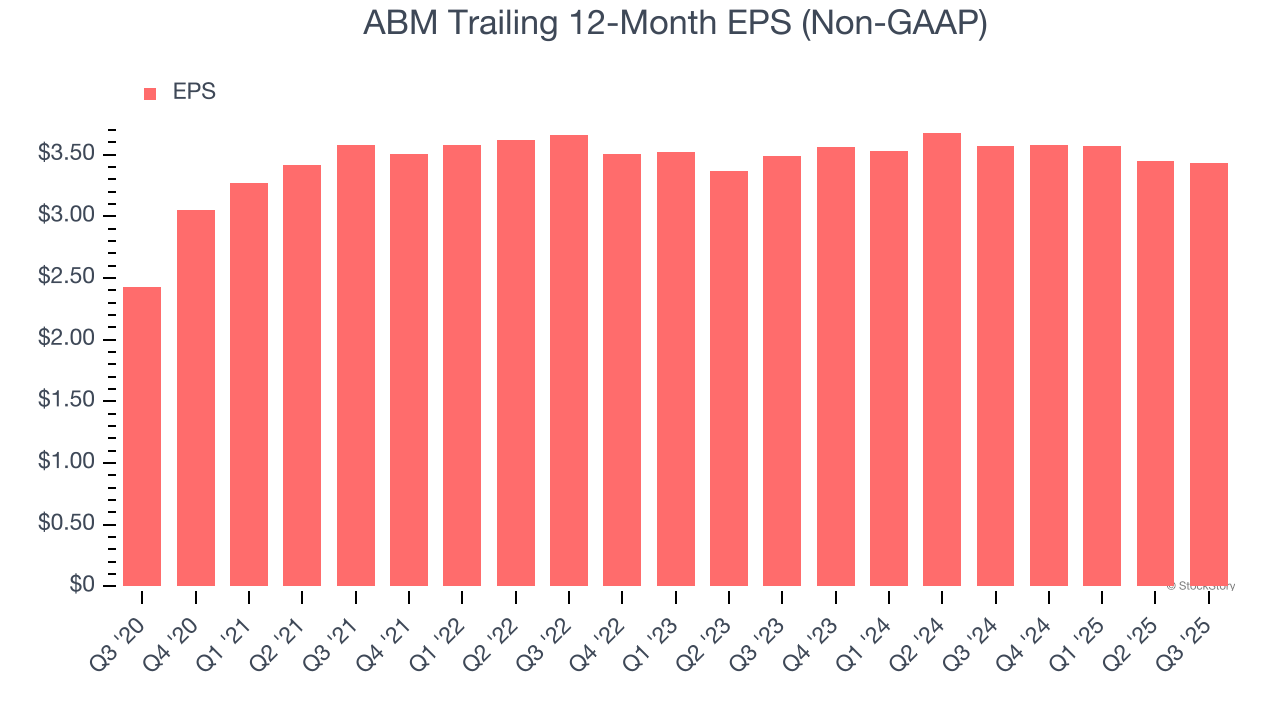
Like with revenue, we analyze EPS over a shorter period to see if we are missing a change in the business.
ABM’s flat two-year EPS was bad and lower than its 3.9% two-year revenue growth.
Diving into the nuances of ABM’s earnings can give us a better understanding of its performance. While we mentioned earlier that ABM’s operating margin expanded this quarter, a two-year view shows its margin has declined. This was the most relevant factor (aside from the revenue impact) behind its lower earnings; interest expenses and taxes can also affect EPS but don’t tell us as much about a company’s fundamentals.
In Q3, ABM reported adjusted EPS of $0.88, down from $0.90 in the same quarter last year. This print missed analysts’ estimates. Over the next 12 months, Wall Street expects ABM’s full-year EPS of $3.43 to grow 17.6%.
Key Takeaways from ABM’s Q3 Results
It was good to see ABM narrowly top analysts’ revenue expectations this quarter. We were also happy its organic revenue was in line with Wall Street’s estimates. On the other hand, its EPS missed and its full-year EPS guidance fell slightly short of Wall Street’s estimates. Overall, this was a weaker quarter. The stock traded down 1.6% to $45 immediately after reporting.
ABM didn’t show it’s best hand this quarter, but does that create an opportunity to buy the stock right now? If you’re making that decision, you should consider the bigger picture of valuation, business qualities, as well as the latest earnings. We cover that in our actionable full research report which you can read here, it’s free for active Edge members.


