

Media broadcasting company met Wall Street’s revenue expectations in Q4 CY2024, with sales up 21.5% year on year to $1 billion. On the other hand, next quarter’s revenue guidance of $772 million was less impressive, coming in 3.5% below analysts’ estimates. Its GAAP profit of $2.61 per share was 30.8% above analysts’ consensus estimates.
Is now the time to buy Sinclair? Find out by accessing our full research report, it’s free.
Sinclair (SBGI) Q4 CY2024 Highlights:
- Revenue: $1 billion vs analyst estimates of $1.01 billion (21.5% year-on-year growth, in line)
- EPS (GAAP): $2.61 vs analyst estimates of $2.00 (30.8% beat)
- Adjusted EBITDA: $330 million vs analyst estimates of $321.3 million (32.9% margin, 2.7% beat)
- Revenue Guidance for Q1 CY2025 is $772 million at the midpoint, below analyst estimates of $799.6 million
- EBITDA guidance for Q1 CY2025 is $96 million at the midpoint, below analyst estimates of $123.7 million
- Operating Margin: 26.5%, up from -46.7% in the same quarter last year
- Market Capitalization: $971.7 million
“We are pleased to close out a strong 2024 and we have entered 2025 on a high note. Our consolidated Adjusted EBITDA for the fourth quarter exceeded our guidance range, along with various other key financial metrics. This performance underscores the continued dominance of broadcast TV as the leading platform for advertisers to reach broad audiences,” said Chris Ripley, Sinclair’s President and Chief Executive Officer.
Company Overview
With a massive footprint of 185 stations broadcasting 640 channels across 86 markets, Sinclair (NASDAQ: SBGI) operates a network of local television stations across the US, producing news content and distributing programming from major networks like FOX, ABC, CBS, and NBC.
Broadcasting
Broadcasting companies have been facing secular headwinds in the form of consumers abandoning traditional television and radio in favor of streaming services. As a result, many broadcasting companies have evolved by forming distribution agreements with major streaming platforms so they can get in on part of the action, but will these subscription revenues be as high quality and high margin as their legacy revenues? Only time will tell which of these broadcasters will survive the sea changes of technological advancement and fragmenting consumer attention.
Sales Growth
A company’s long-term performance is an indicator of its overall quality. While any business can experience short-term success, top-performing ones enjoy sustained growth for years. Sinclair’s demand was weak over the last five years as its sales fell at a 3.5% annual rate. This was below our standards and suggests it’s a low quality business.
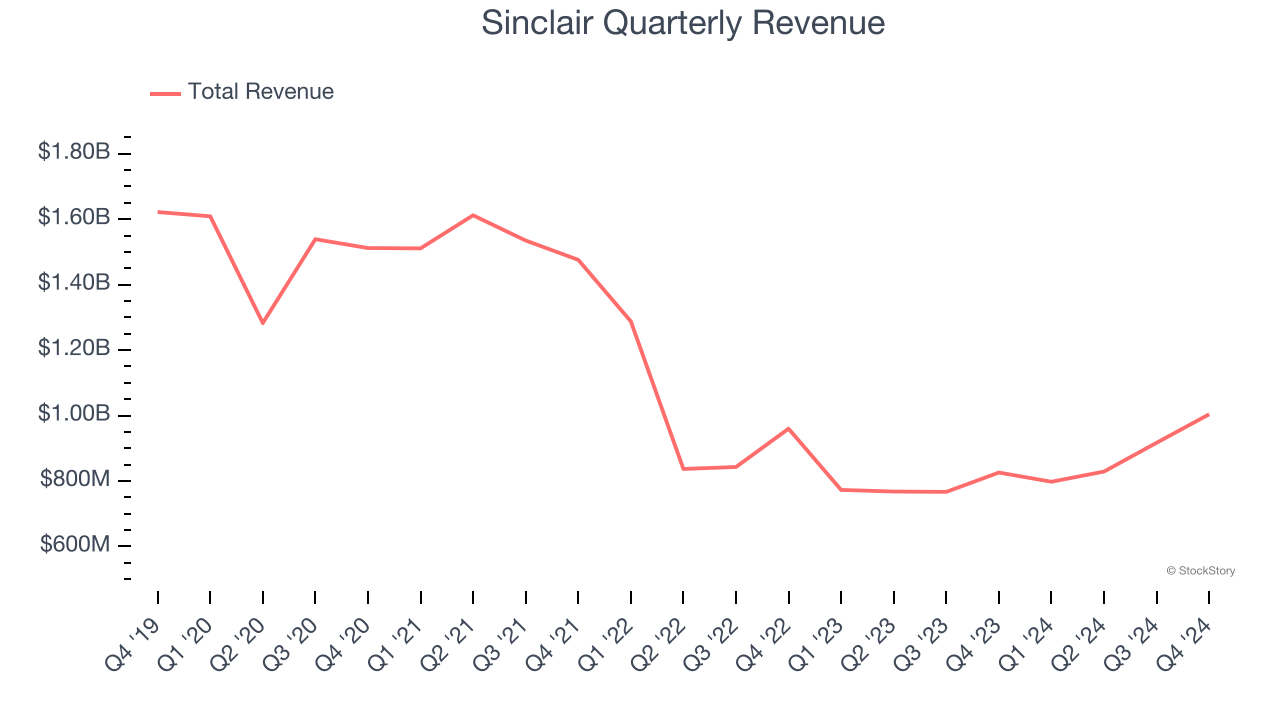
Long-term growth is the most important, but within consumer discretionary, product cycles are short and revenue can be hit-driven due to rapidly changing trends and consumer preferences. Sinclair’s recent history shows its demand has stayed suppressed as its revenue has declined by 5% annually over the last two years. 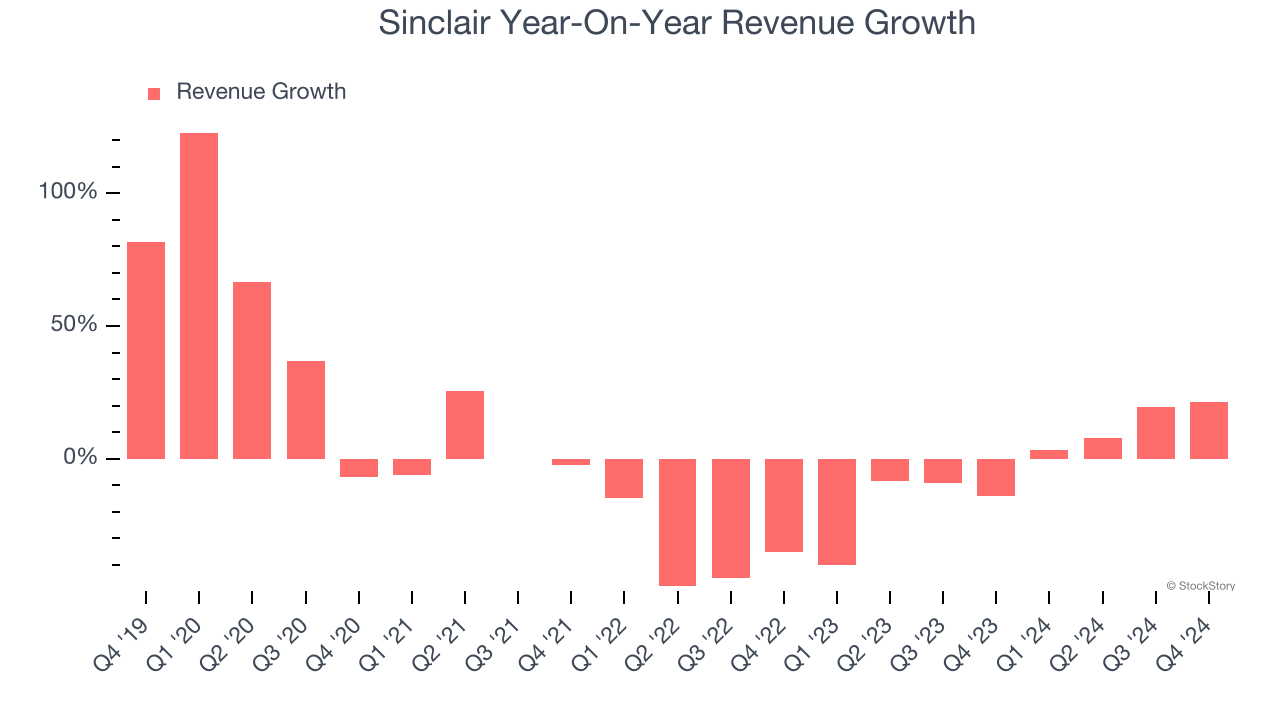
Sinclair also breaks out the revenue for its most important segments, Distribution and Advertising, which are 43.9% and 31% of revenue. Over the last two years, Sinclair’s Distribution revenue (content distribution) averaged 4.9% year-on-year declines while its Advertising revenue (advertising sales) averaged 3.9% declines.
This quarter, Sinclair’s year-on-year revenue growth of 21.5% was excellent, and its $1 billion of revenue was in line with Wall Street’s estimates. Company management is currently guiding for a 3.3% year-on-year decline in sales next quarter.
Looking further ahead, sell-side analysts expect revenue to decline by 7.9% over the next 12 months, a slight deceleration versus the last two years. This projection is underwhelming and suggests its products and services will see some demand headwinds.
Unless you’ve been living under a rock, it should be obvious by now that generative AI is going to have a huge impact on how large corporations do business. While Nvidia and AMD are trading close to all-time highs, we prefer a lesser-known (but still profitable) stock benefiting from the rise of AI. Click here to access our free report one of our favorites growth stories.
Cash Is King
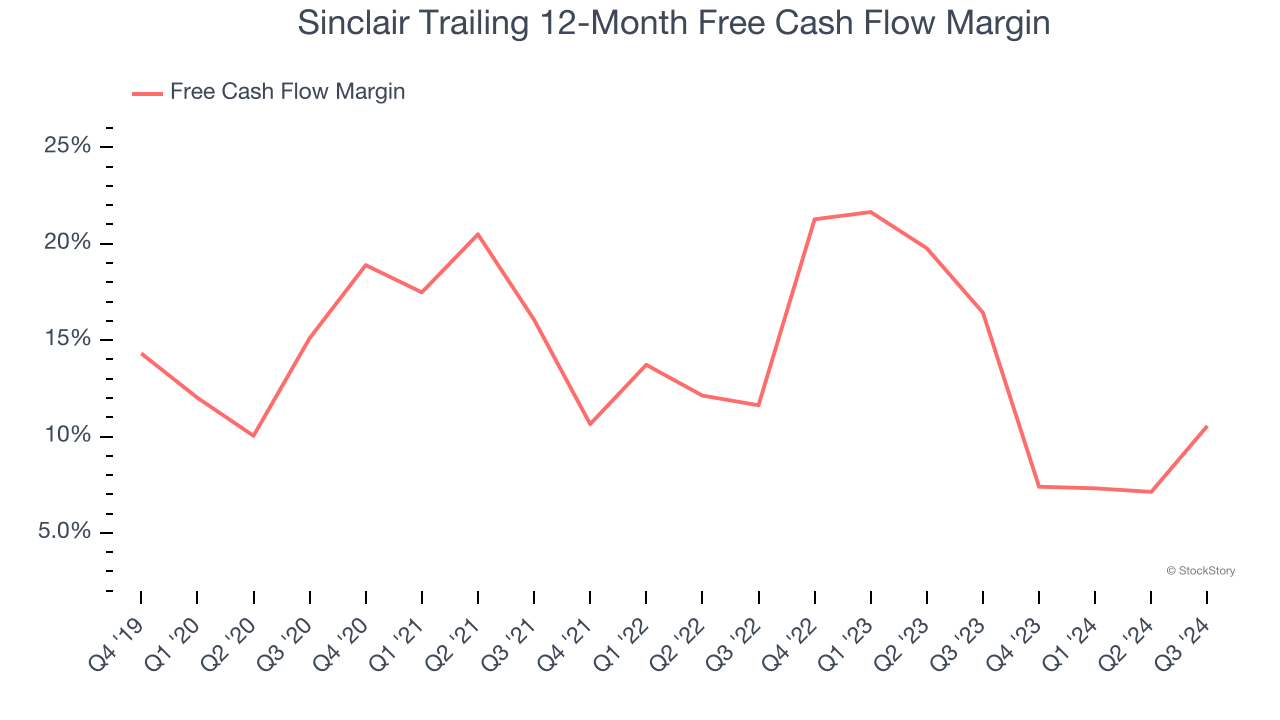
Although earnings are undoubtedly valuable for assessing company performance, we believe cash is king because you can’t use accounting profits to pay the bills.
Sinclair has shown mediocre cash profitability over the last two years, giving the company limited opportunities to return capital to shareholders. Its free cash flow margin averaged 8.7%, subpar for a consumer discretionary business.
Key Takeaways from Sinclair’s Q4 Results
We were impressed by how significantly Sinclair blew past analysts’ EPS expectations this quarter. We were also happy its EBITDA outperformed. On the other hand, its revenue and EBITDA guidance for next quarter missed. Overall, this was a mixed quarter. The stock traded up 3.6% to $15 immediately following the results.
Should you buy the stock or not? We think that the latest quarter is only one piece of the longer-term business quality puzzle. Quality, when combined with valuation, can help determine if the stock is a buy. We cover that in our actionable full research report which you can read here, it’s free.


