

Toy and entertainment company Hasbro (NASDAQ: HAS) reported Q2 CY2025 results beating Wall Street’s revenue expectations, but sales fell by 1.5% year on year to $980.8 million. Its non-GAAP profit of $1.30 per share was 68.6% above analysts’ consensus estimates.
Is now the time to buy Hasbro? Find out by accessing our full research report, it’s free.
Hasbro (HAS) Q2 CY2025 Highlights:
- Revenue: $980.8 million vs analyst estimates of $882.1 million (1.5% year-on-year decline, 11.2% beat)
- Adjusted EPS: $1.30 vs analyst estimates of $0.77 (68.6% beat)
- Adjusted EBITDA: $302 million vs analyst estimates of $227.6 million (30.8% margin, 32.7% beat)
- EBITDA guidance for the full year is $1.19 billion at the midpoint, above analyst estimates of $1.12 billion
- Operating Margin: -81.4%, down from 21.3% in the same quarter last year
- Free Cash Flow Margin: 1.5%, down from 13.6% in the same quarter last year
- Market Capitalization: $10.87 billion
“Hasbro’s return to growth in the first half of 2025 is clear validation that our Playing to Win strategy is working,” said Chris Cocks, Chief Executive Officer, Hasbro,
Company Overview
Credited with the creation of toys such as Mr. Potato Head and the Rubik’s Cube, Hasbro (NASDAQ: HAS) is a global entertainment company offering a diverse range of toys, games, and multimedia experiences for children and families.
Revenue Growth
Reviewing a company’s long-term sales performance reveals insights into its quality. Any business can have short-term success, but a top-tier one grows for years. Hasbro’s demand was weak over the last five years as its sales fell at a 3.1% annual rate. This wasn’t a great result and suggests it’s a low quality business.
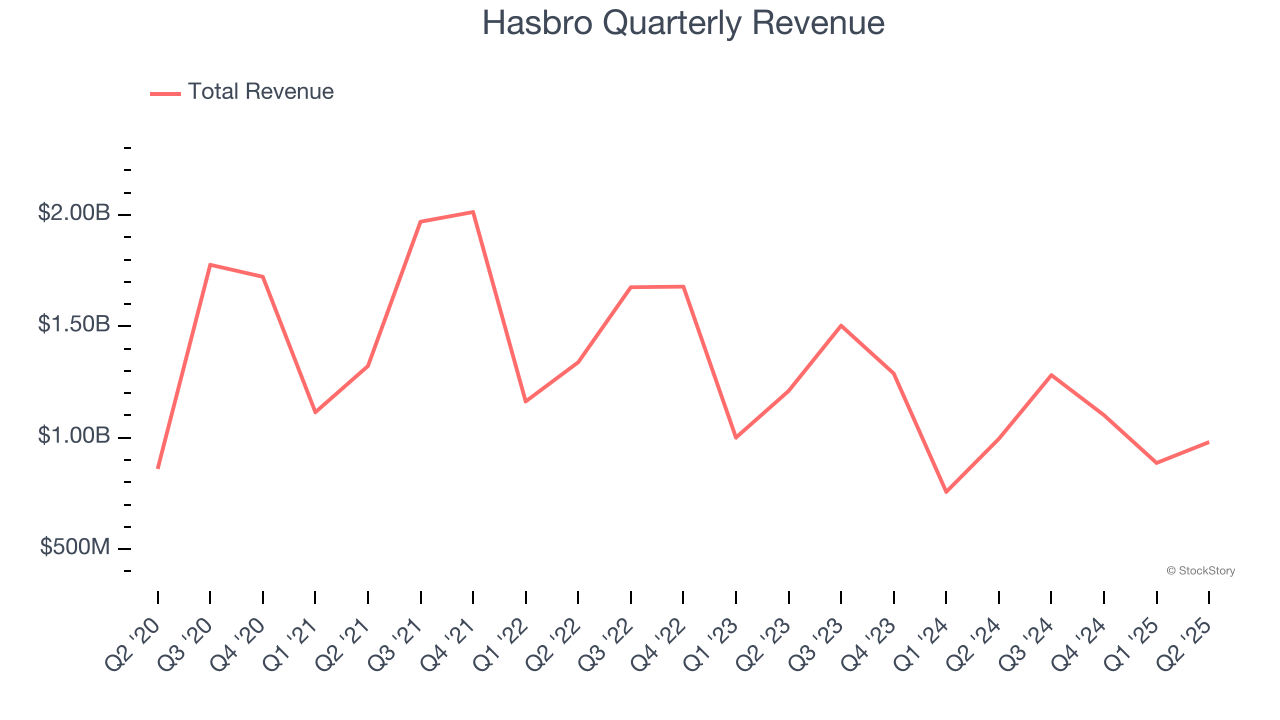
We at StockStory place the most emphasis on long-term growth, but within consumer discretionary, a stretched historical view may miss a company riding a successful new product or trend. Hasbro’s recent performance shows its demand remained suppressed as its revenue has declined by 12.6% annually over the last two years. 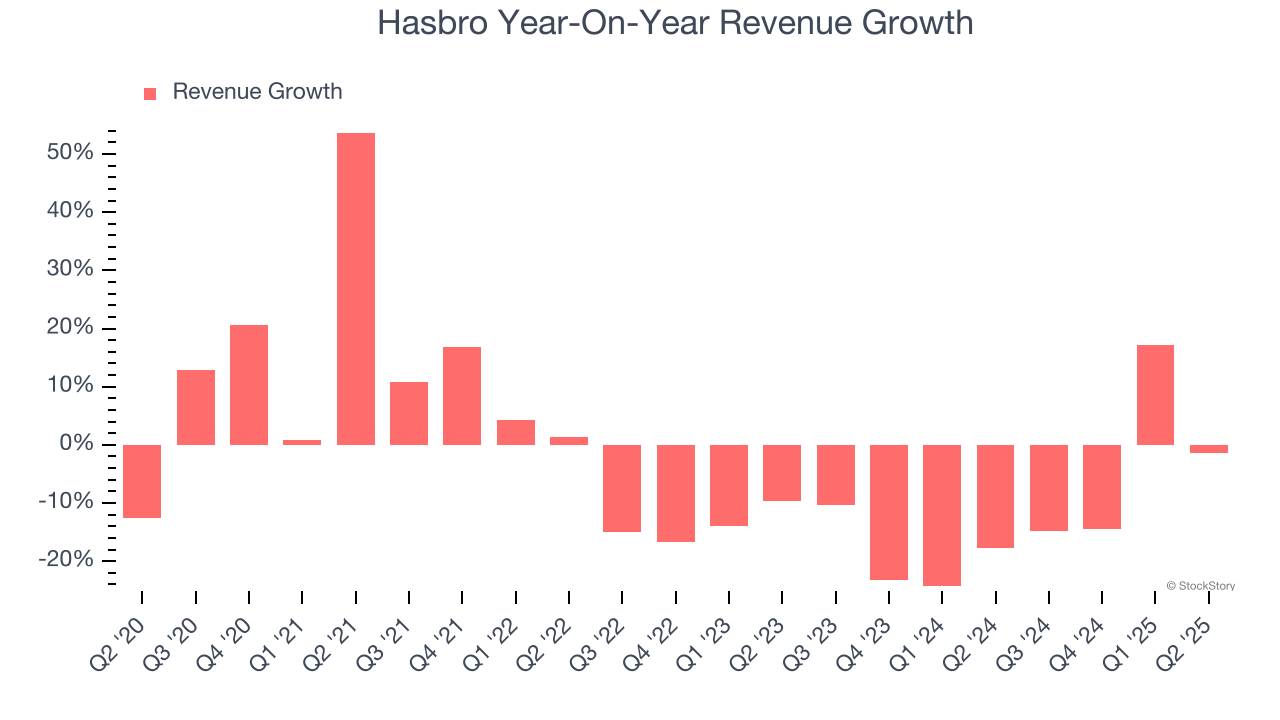
Hasbro also breaks out the revenue for its three most important segments: Consumer Products, Entertainment, and Wizards & Digital Gaming, which are 53.3%, 45.1%, and 1.6% of revenue. Over the last two years, Hasbro’s Consumer Products revenue (toys, games, apparel) averaged 12.3% year-on-year declines, but its Entertainment (content) and Wizards & Digital Gaming (Wizards of the Coast) revenues averaged 226% and 1.6% growth.
This quarter, Hasbro’s revenue fell by 1.5% year on year to $980.8 million but beat Wall Street’s estimates by 11.2%.
Looking ahead, sell-side analysts expect revenue to remain flat over the next 12 months. Although this projection implies its newer products and services will spur better top-line performance, it is still below average for the sector.
Unless you’ve been living under a rock, it should be obvious by now that generative AI is going to have a huge impact on how large corporations do business. While Nvidia and AMD are trading close to all-time highs, we prefer a lesser-known (but still profitable) stock benefiting from the rise of AI. Click here to access our free report one of our favorites growth stories.
Operating Margin
Operating margin is an important measure of profitability as it shows the portion of revenue left after accounting for all core expenses – everything from the cost of goods sold to advertising and wages. It’s also useful for comparing profitability across companies with different levels of debt and tax rates because it excludes interest and taxes.
Hasbro’s operating margin has risen over the last 12 months, but it still averaged negative 14.8% over the last two years. This is due to its large expense base and inefficient cost structure.
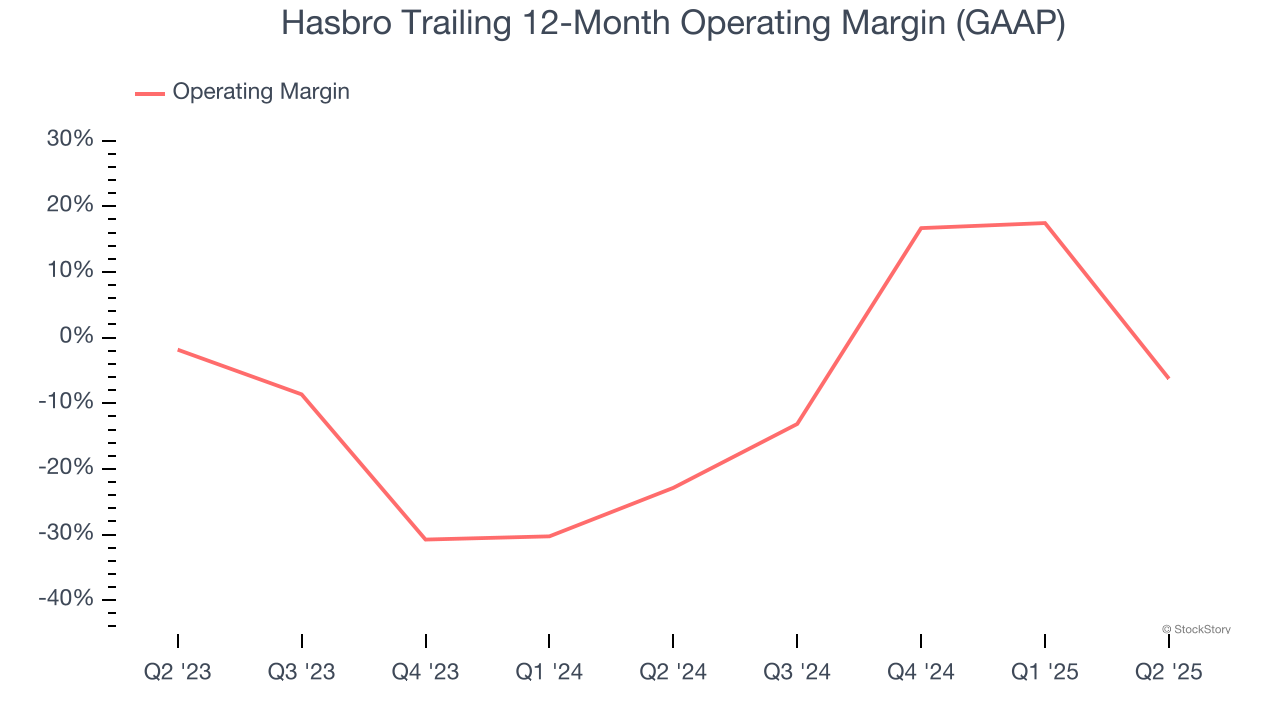
In Q2, Hasbro generated a negative 81.4% operating margin. The company's consistent lack of profits raise a flag.
Earnings Per Share
Revenue trends explain a company’s historical growth, but the long-term change in earnings per share (EPS) points to the profitability of that growth – for example, a company could inflate its sales through excessive spending on advertising and promotions.
Hasbro’s EPS grew at an unimpressive 4.3% compounded annual growth rate over the last five years. This performance was better than its 3.1% annualized revenue declines, but we take it with a grain of salt because its operating margin didn’t improve and it didn’t repurchase its shares, meaning the delta came from reduced interest expenses or taxes.
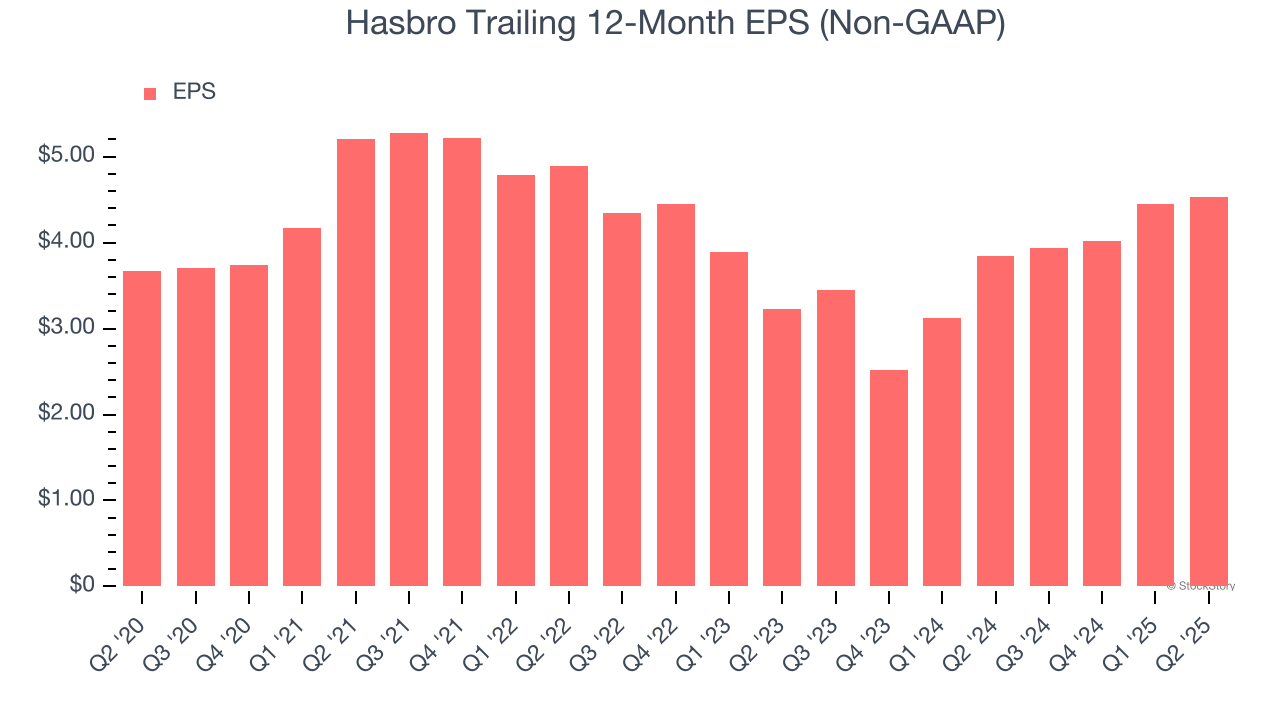
In Q2, Hasbro reported EPS at $1.30, up from $1.22 in the same quarter last year. This print easily cleared analysts’ estimates, and shareholders should be content with the results. Over the next 12 months, Wall Street expects Hasbro’s full-year EPS of $4.53 to stay about the same.
Key Takeaways from Hasbro’s Q2 Results
We were impressed by how significantly Hasbro blew past analysts’ EPS expectations this quarter. We were also excited its EBITDA outperformed Wall Street’s estimates by a wide margin. Zooming out, we think this was a solid print. The stock traded up 4.4% to $81 immediately following the results.
Indeed, Hasbro had a rock-solid quarterly earnings result, but is this stock a good investment here? What happened in the latest quarter matters, but not as much as longer-term business quality and valuation, when deciding whether to invest in this stock. We cover that in our actionable full research report which you can read here, it’s free.


