
 Photo from Unsplash
Originally Posted On: https://www.highspeedoptions.com/resources/insights/current-state-of-the-internet
Today, 9 out of 10 adults in America use the internet, which is nearly double what it was just two decades ago. Personally, I don’t know anyone who doesn’t use the internet – do you? What was once an optional perk is now essential for nearly every aspect of our lives. And while it’s fun to quip about living an “unplugged” lifestyle, that nice sentiment can only get a person so far in this digital age. With technology driving more connectivity these days, reliable internet service is crucial.
To illustrate this shift in how people connect, we did a pulse check on the current state of the internet in the United States. Explore who has access to reliable internet, what technology is most preferred, and where the internet still has room for improvement.
Internet Access in the USAccording to the Federal Communications Commission (FCC), broadband internet requires a minimum download speed of up to 25 Mbps and an upload speed of up to 3 Mbps. Based on this definition, we did some digging to see exactly who has access to broadband service in the US and how those numbers break down globally, nationally, and demographically.
World Internet UsageAs of April 2021, the United States ranks third in the world for having the largest number of active internet users (~313 million), barely outpaced by India and China when you take into account each country’s overall population. The US is a global hub for technological innovation and international 500 corporations, positioning itself as a world leader in the telecom industry.
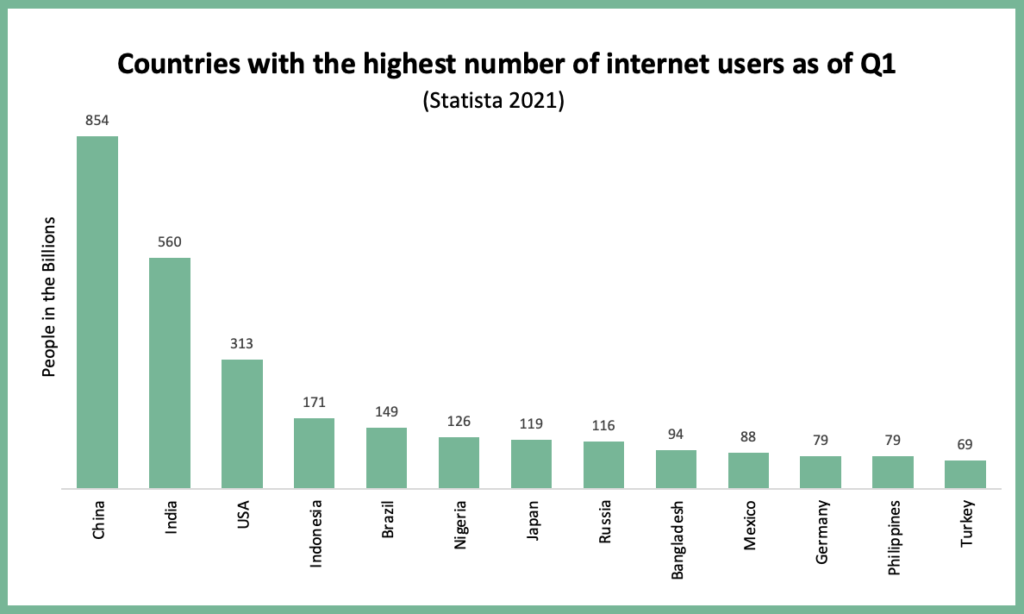 Source: Statista
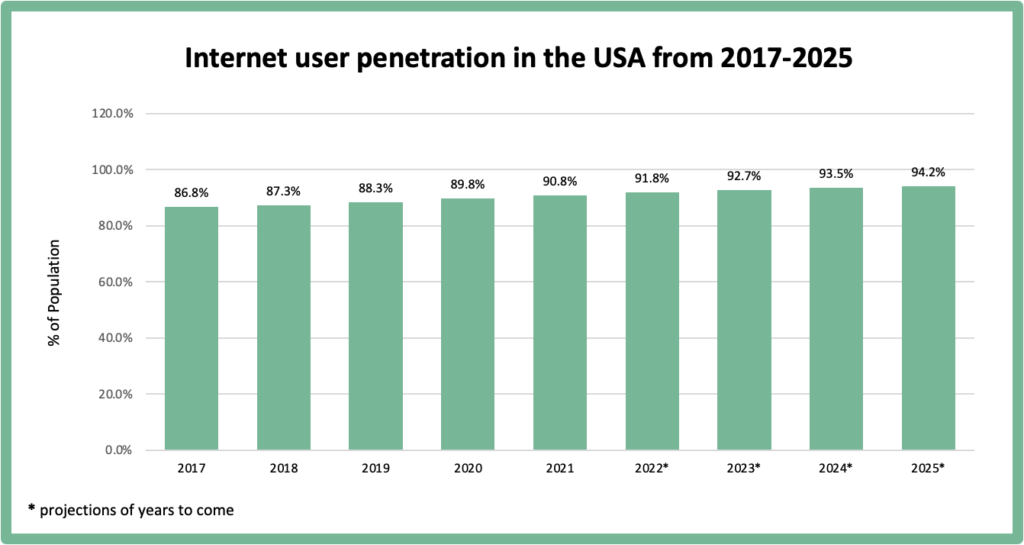
In total, the United States is made of over 332 million people, and over 90% of that population relies on the internet in one way or another. That equates to about 313 million people overall. Data firm Statista predicts that as much as 94% will be connected to the internet by 2025. Compare that to China above, where only 61% of its population uses the internet today. In terms of connectivity, the US ranks first.
 Source: Statista
On a national level, you can see that not all states offer the same level of connectivity. Take New Mexico, for example. For the last five years, New Mexico has ranked last for hInternt aving the slowest broadband speeds of all 50 states. A few factors that play into this are its vast desert and rugged landscape. However, California and Nevada can say the same geographically, yet they rank among the top connected states in the US. According to Statista, the top states with the fastest broadband speeds available include:
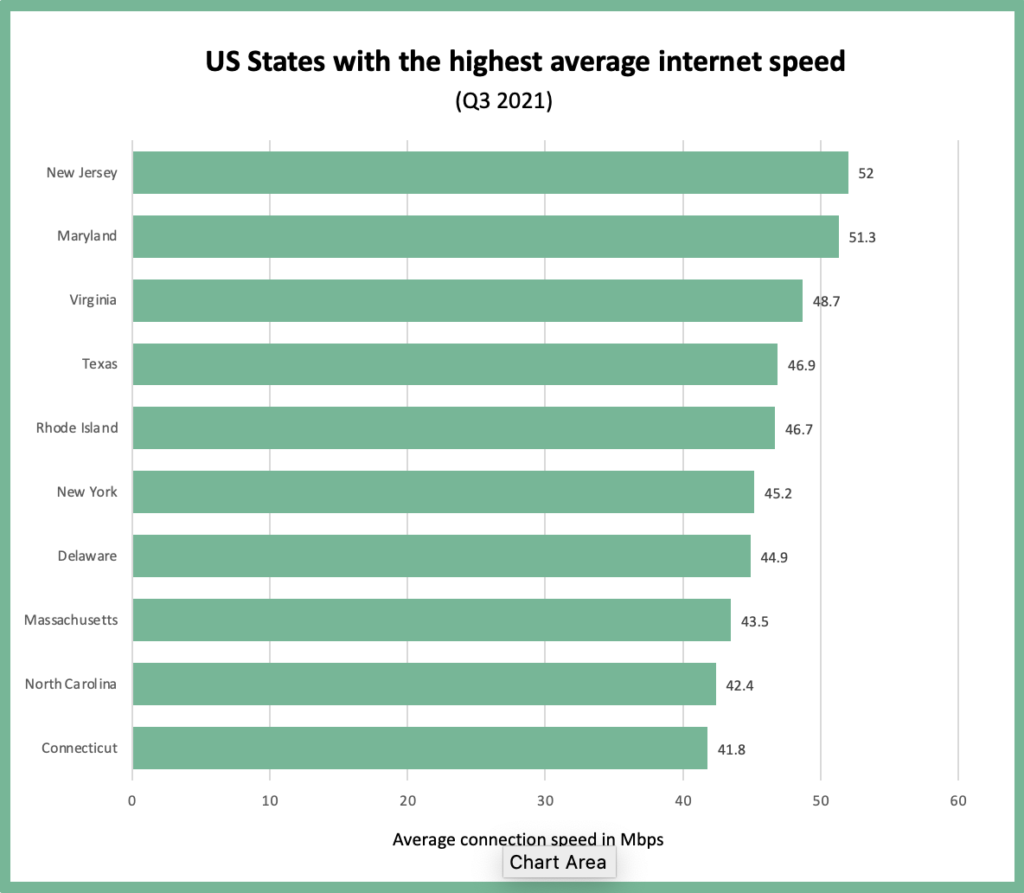 Source: Statista
People’s ability to get home broadband varies based on a lot of factors such as age, education, and household income. According to the Pew Research Center, the main barrier to access is cost. Households with a greater income invariably tend to sign up for internet service, and higher speed packages at that. You can further breakdowns below.
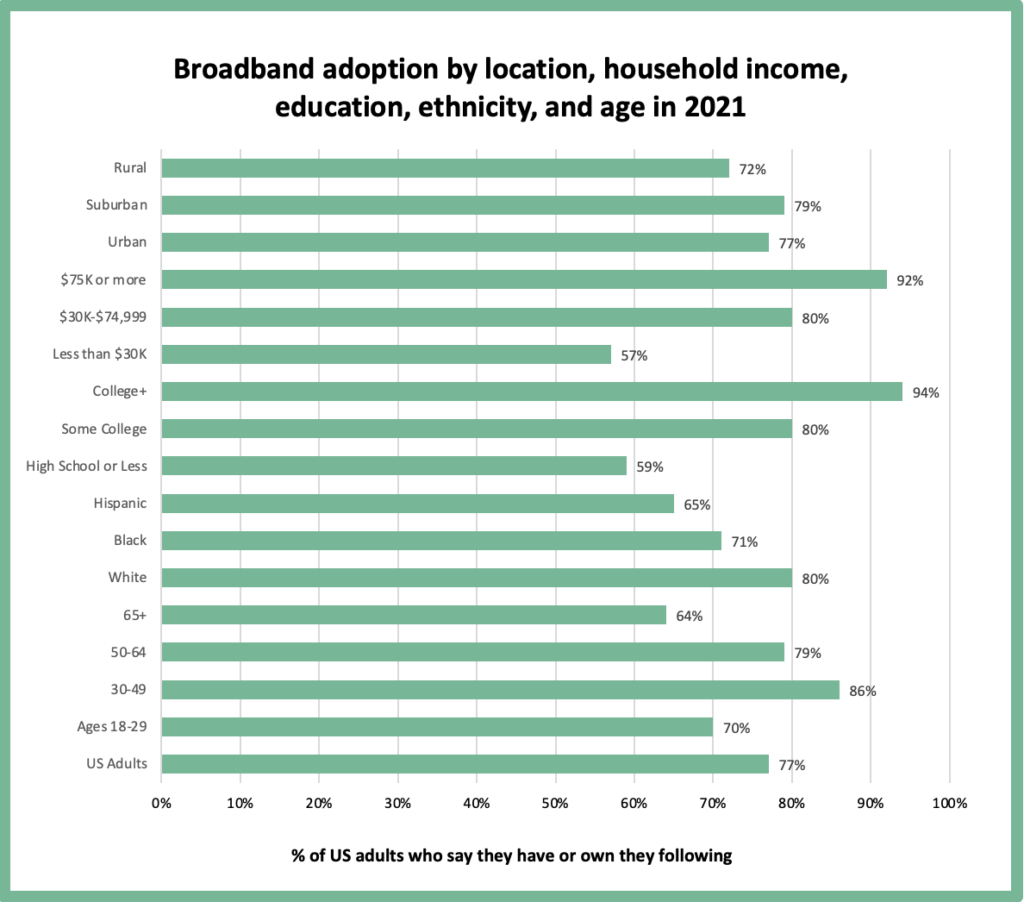 Source: Pew Research Center
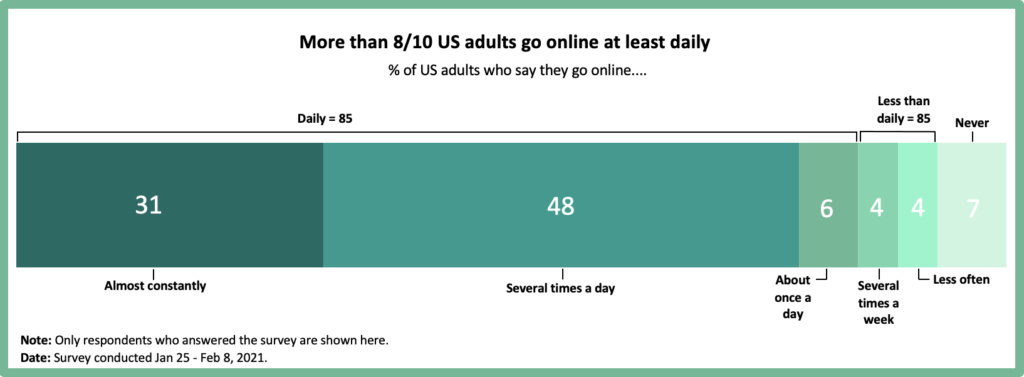
For those that are connected to the internet, you have to wonder what the average screen time is. According to the Pew Research Center, about 85% of connected Americans say they go online at least once a day. Of those users, 31% say they are constantly connected to the internet.
 Source: Pew Research Center
While the FCC and ISPs are working to close the digital divide, the United States’ internet options are still very limited in some parts of the country. Despite increased internet adoption, many people still opt out of home internet, citing access, cost, or smartphone usage as reasons why.
AccessAccording to the FCC’s 2020 Broadband Deployment Report, roughly 6% of all Americans have zero access to fixed broadband at home. Not as surprising, a majority of those without access live in rural areas. Overall, that 6% estimation equates to about 19 million people today who don’t have even one internet provider nearby. Without a reliable internet connection, you can imagine how limited your job prospects, schooling, and social connections can be.
Still, we can’t discuss internet access without also looking at the cost of internet. While some 19 million Americans don’t have access at all, as many as one in three Americans choose to not subscribe to internet service because of how expensive it is.
AffordabilityFCC data shows that nearly 35% of Americans, or about 114 million people, do not subscribe to broadband service at their homes. Cost is often cited as the main factor in this decision. Despite government efforts to incentivize ISPs to expand their networks, America still lags behind other developed countries when it comes to the cost of internet.
In a 2020 study by New America, it turns out that we pay more for internet service than most developed countries in Asia and Europe, regardless of speed. Before factoring in data caps and other ancillary ISP fees, Americans pay “nearly twice as much as European countries for high-speed internet.”
Granted, if you focus nationally, you’ll find that broadband costs are steadily improving. According to the latest USTelecom Broadband Pricing Index, US broadband services have become both cheaper and faster for lower and middle-class families over the last six years.
For example, entry-level broadband plans have decreased in monthly price from $45.58 in 2015 to $31.35 in 2021 and have increased in download speed from 22.3 Mbps in 2015 to 58.4 Mbps in 2021. Those are significant improvements. And while there’s still room for growth, the data suggest that internet is getting cheaper each year.
Smartphones over home broadbandA newer explanation for the lack of home broadband subscribers is smartphone dependency. According to the Pew Research Center, as much as “15% of US adults are smartphone-only internet users – that is, they have a smartphone, but do not have a home broadband connection.”
For context, that’s about 50 million people who choose to solely use their smartphones at home rather than subscribe to broadband service.
Isn’t it interesting? As technology becomes more efficient, we’re likely to see even more people opt for smaller devices as a means to connect to the internet. Below, we break down further how people’s behaviors have shifted towards a mobile lifestyle.
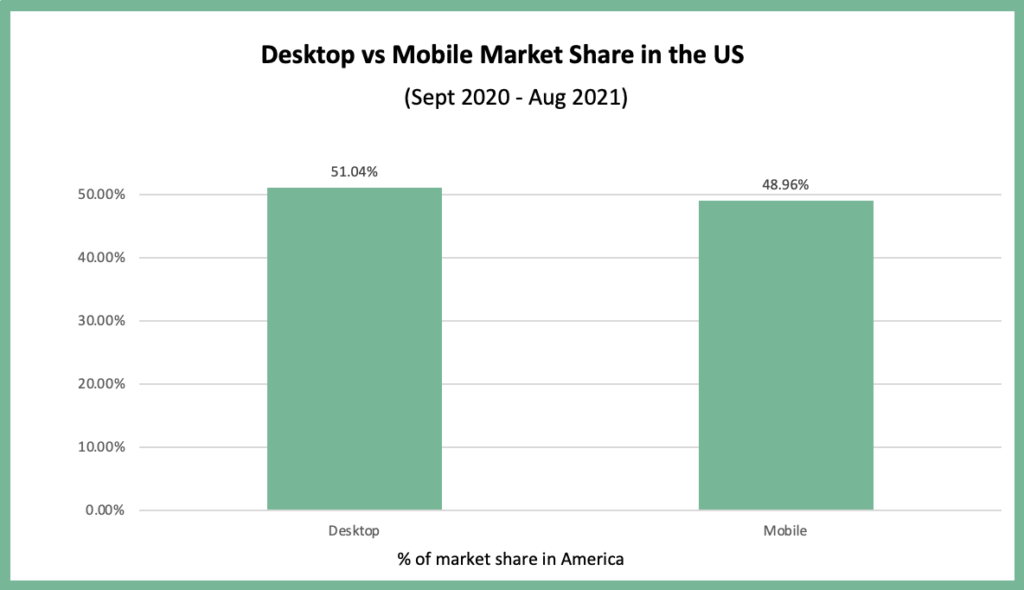
Mobile & Desktop UsageBuilding on the smartphone-only trend, it appears that Americans also prefer mobile devices over desktops or laptops for their news, entertainment, and communication. According to GlobalStats, over 51% of website traffic in the US came from mobile devices whereas about 49% came from desktops in the last year. It’s nearly even, however, there is a steady increase in smartphone dependence month-over-month.
 Source: GlobalStats
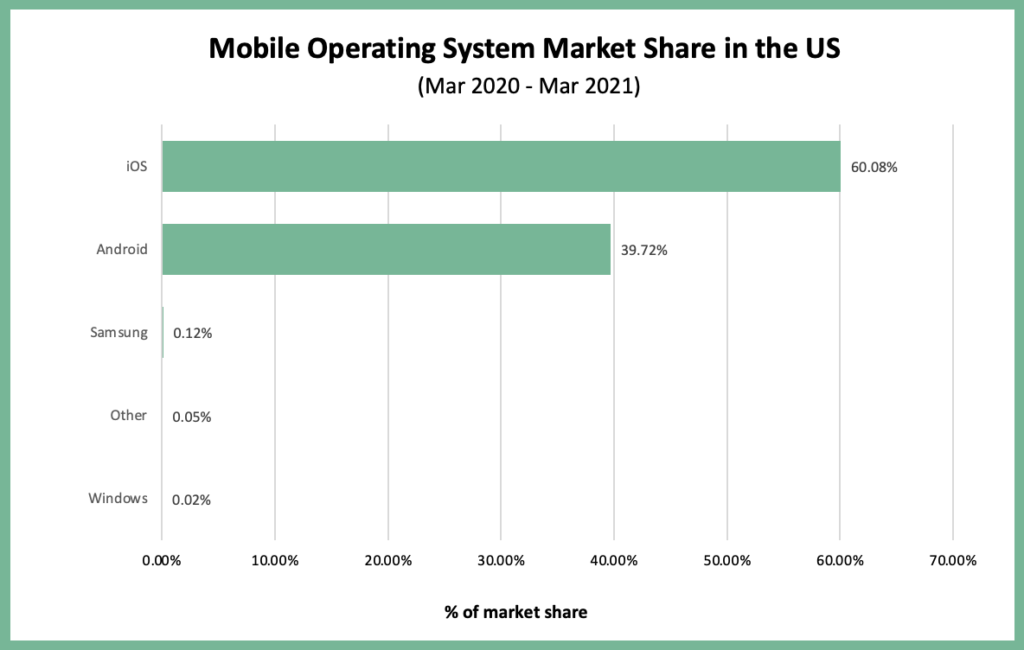
Now, let’s check out what operating systems users prefer to use on mobile devices to access the internet. As you can see, Apple iOS is the most popular by a wide margin.
 Source: GlobalStats
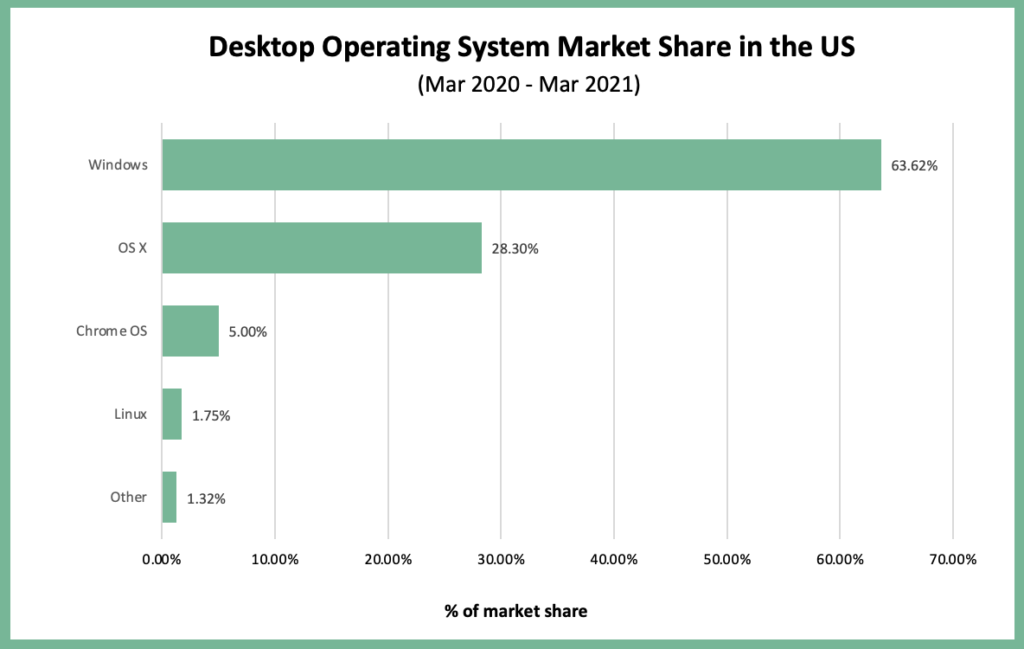
For desktops, user preference changes a bit. According to GlobalStats, more than twice as many users favor the Microsoft Windows operating system to access the internet from their computer. Now, whether that’s actually due to the Windows interface or how much cheaper Windows products are compared to Apple products is up for debate. We suspect it’s a mix of the two.
 Source: GlobalStats
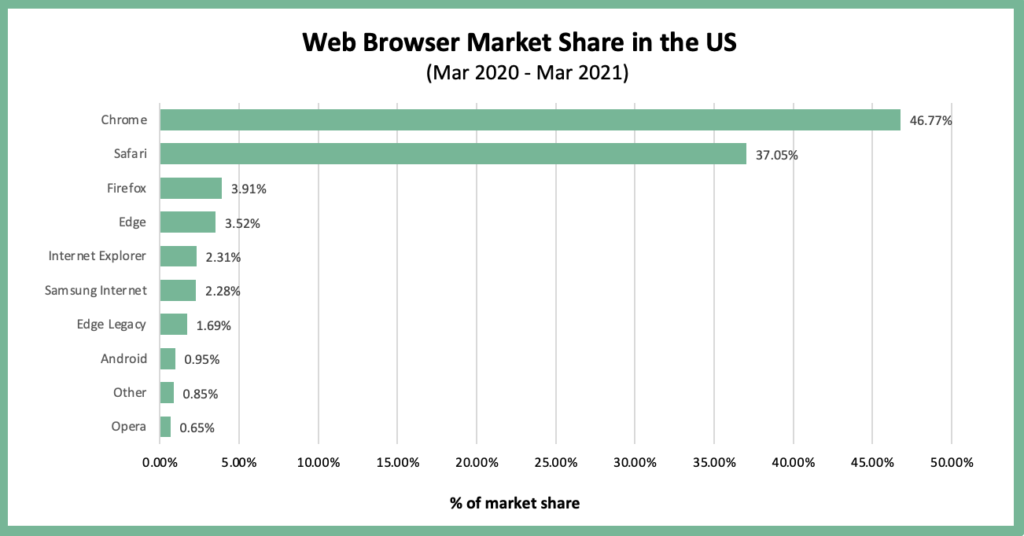
As a search engine, Google dominates the market with over 92% market share as of June 2021. However, as a web browser application, Google Chrome shares the stage with Apple Safari. Chrome possesses over 46% of the browser market while Safari is about 37% of the market share. Now, the question of which browser is better is largely up for debate.
 Source: GlobalStats
As dependence on the internet increases, so does our need for online safety. Many users recognize the risks of doing business online and are starting to proactively invest in internet security tools. After all, wherever the money flows, criminals will likely go. With banking, shopping, and communications shifting online, the internet is ripe for cyberattacks. Here are a few helpful internet tools gaining popularity today:
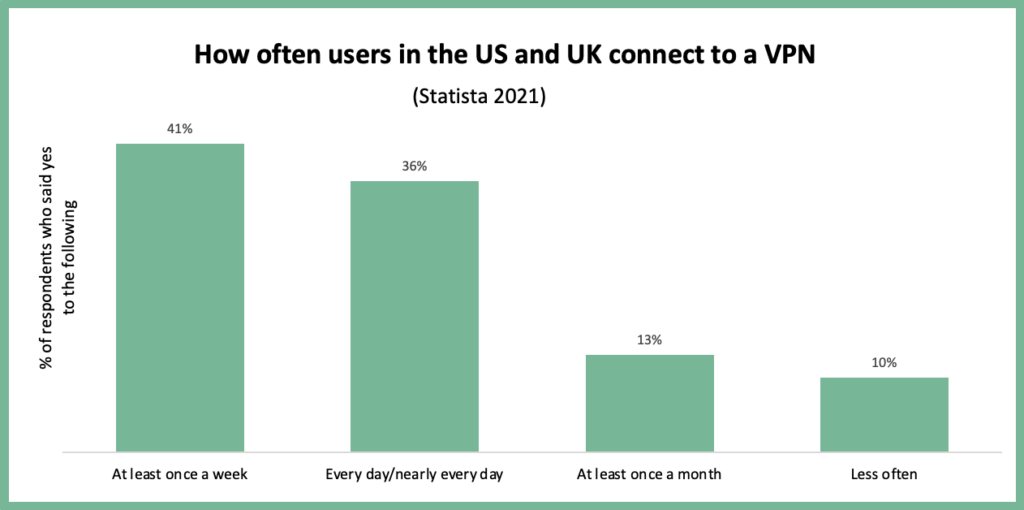
Virtual Private NetworksA virtual private network (VPN) is an online service that provides privacy and security while connected to the internet. It masks your real IP address and encrypts your data, so you can’t be tracked or monitored by online snoopers. In a 2020 Statista study polling US and UK VPN users, roughly 41% of respondents said they use a VPN at least once a week, while 36% claim to use a VPN every day. As it relates to the US, that’s as many as 136 million users.
 Source: Statista
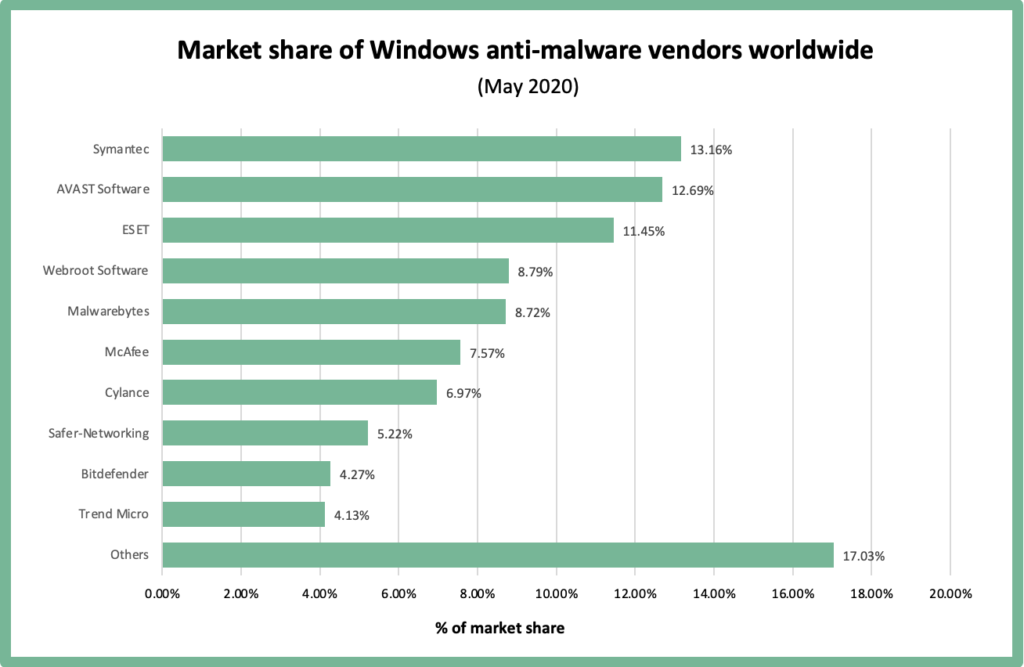
While VPNs focus on user privacy, other internet software like antivirus or anti-malware protection are also important for security purposes. According to AV-Test, the Independent IT-Security Institute, there are over 450,000 new malware programs each day. In 2020, that equated to about 1.1 billion attacks total.
To combat this, more users are investing in cybersecurity software like NortonLifeLock (Symantec) or McAfee to protect their devices when connected to the internet. Here is a breakdown of the most popular security software tools used today, per a Statista report.
 Source: Statista
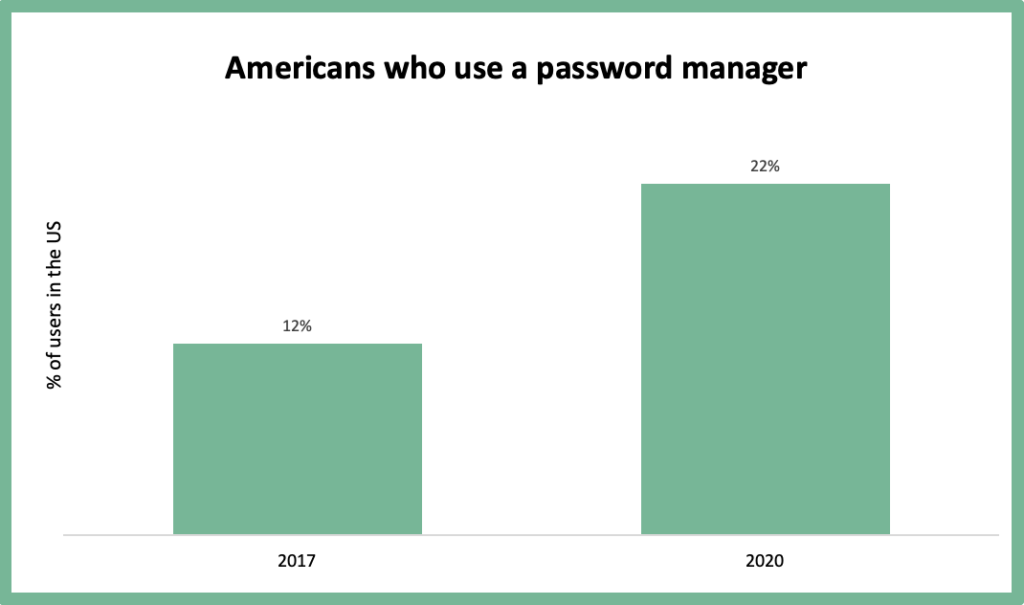
Password managers are slowly making traction as more people move life online. As of 2020, about 22% of Americans use a password manager app to store their logins. This is nearly double what it was in 2017, where only 12% of users relied on one.
 Source: PasswordManager.com
With dozens of accounts to keep track of, the age-old trick of jotting passwords down on a sticky note isn’t practical anymore. We predict that the adoption rate for password apps will steadily increase along with security software and VPN subscriptions.
Closing ThoughtsAs the United States narrows the internet gap at home, our reliance on and need for connectivity will only increase from here. There are still many hurdles to overcome for everyone to gain access to the internet, but we’re well on our way.
In fact, recognizing this, the FCC and internet service providers across the country are actively supporting ways to bring reliable internet to as many Americans as possible. A few ways they’re accomplishing this is by offering financial assistance programs like the Emergency Broadband Benefit and Lifeline. These programs directly help households overcome obstacles such as price and availability.
To see what ISPs are available near you, enter your zip code below!
