
Leading general merchandise and grocery retailer Target Corporation (TGT) is experiencing a notable drop in sales of clothing, home goods, and other discretionary items. This slump represents a significant portion of the company's overall revenue.
More than half of TGT’s merchandise is discretionary. TGT’s primary customer base consists of middle-income households experiencing financial strain due to inflation and escalating costs. Citi analyst Paul Lejuez fears that TGT's high exposure to discretionary sales could be detrimental in the current macroeconomic backdrop.
As of April 29, 2023, TGT’s long-term debt and other borrowings were at a substantial $16.01 billion, a steep rise compared to $13.38 billion on April 30, 2022. This growing amount could potentially pose financial hurdles for the retail giant.
However, TGT recently announced its biggest sale of the season, ‘Target Circle Week,’ from July 9 to 15, with savings of up to 50% on TGT’s owned brands, which could boost the company’s sales.
Despite challenges, TGT is expecting an increase of more than $1 billion in their operating income for the full year, along with an adjusted EPS lying between $7.75 to $8.75.
In terms of forward EV/Sales, TGT is trading at 0.71x, 56.1% lower than the industry average of 1.63x. Also, its forward Price/Sales multiple of 0.55 is 47.9% lower than the industry average of 1.06.
Given this backdrop, let us look at the trends of TGT’s key financial metrics to understand why it might be wise to wait for a better entry point in the stock.
Analyzing Target Corporation's Fiscal Performance and Financial Indicators (August 2020-April 2023)
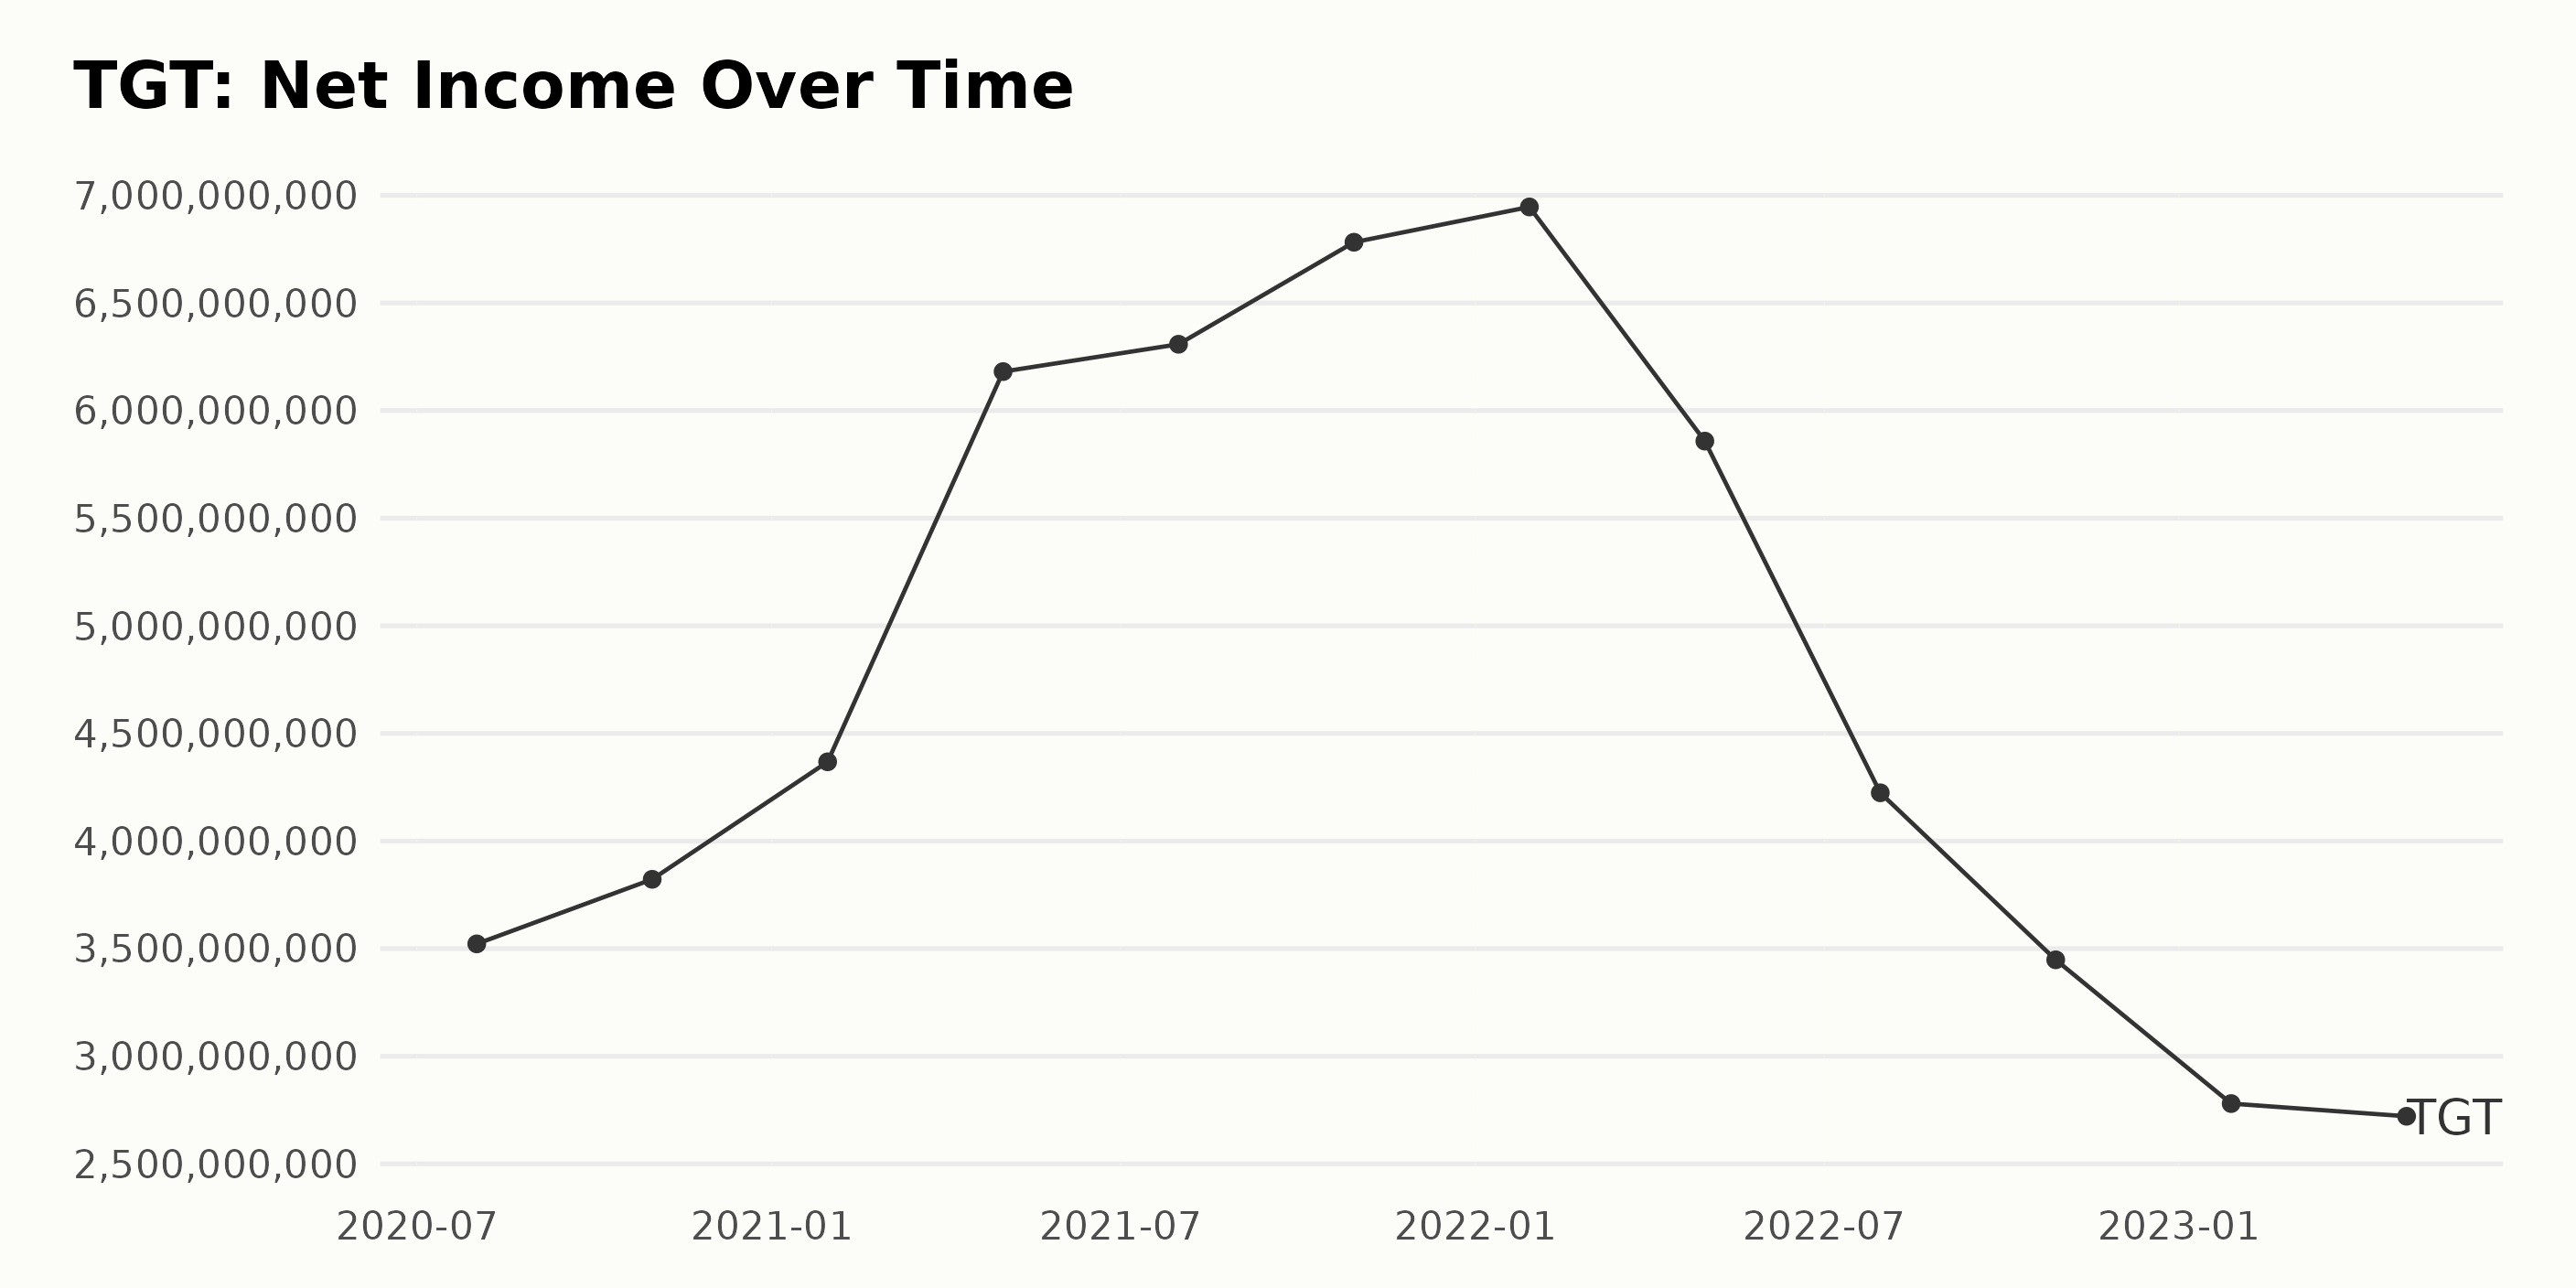
TGT’s trailing-12-month net income has shown overall growth over the period examined but with notable fluctuations. Here are some standout observations:
- August 2020: $3.52 billion
- October 2020: $3.82 billion
- January 2021: $4.37 billion
- May 2021: $6.18 billion
- July 2021: $6.31 billion
- October 2021: $6.78 billion
- January 2022: $6.95 billion
- April 2022: $5.86 billion
- July 2022: $4.22 billion
- October 2022: $3.45 billion
- January 2023: $2.78 billion
- April 2023: $2.72 billion
To summarize, there was a steady increase in net income until January 2022, with net income reaching its peak ($6.95 billion). This marks an impressive increase of nearly 97% from the initial value. However, between January 2022 and October 2022, there was a significant drop (from $6.95 billion to $3.45 billion).
The downward trend continued into April 2023, which brings the total fall to an alarming 61% from its peak in January 2022. As of April 2023, net income stands at $2.72 billion. This shows a reduction of 23% from the first recorded amount in August 2020.
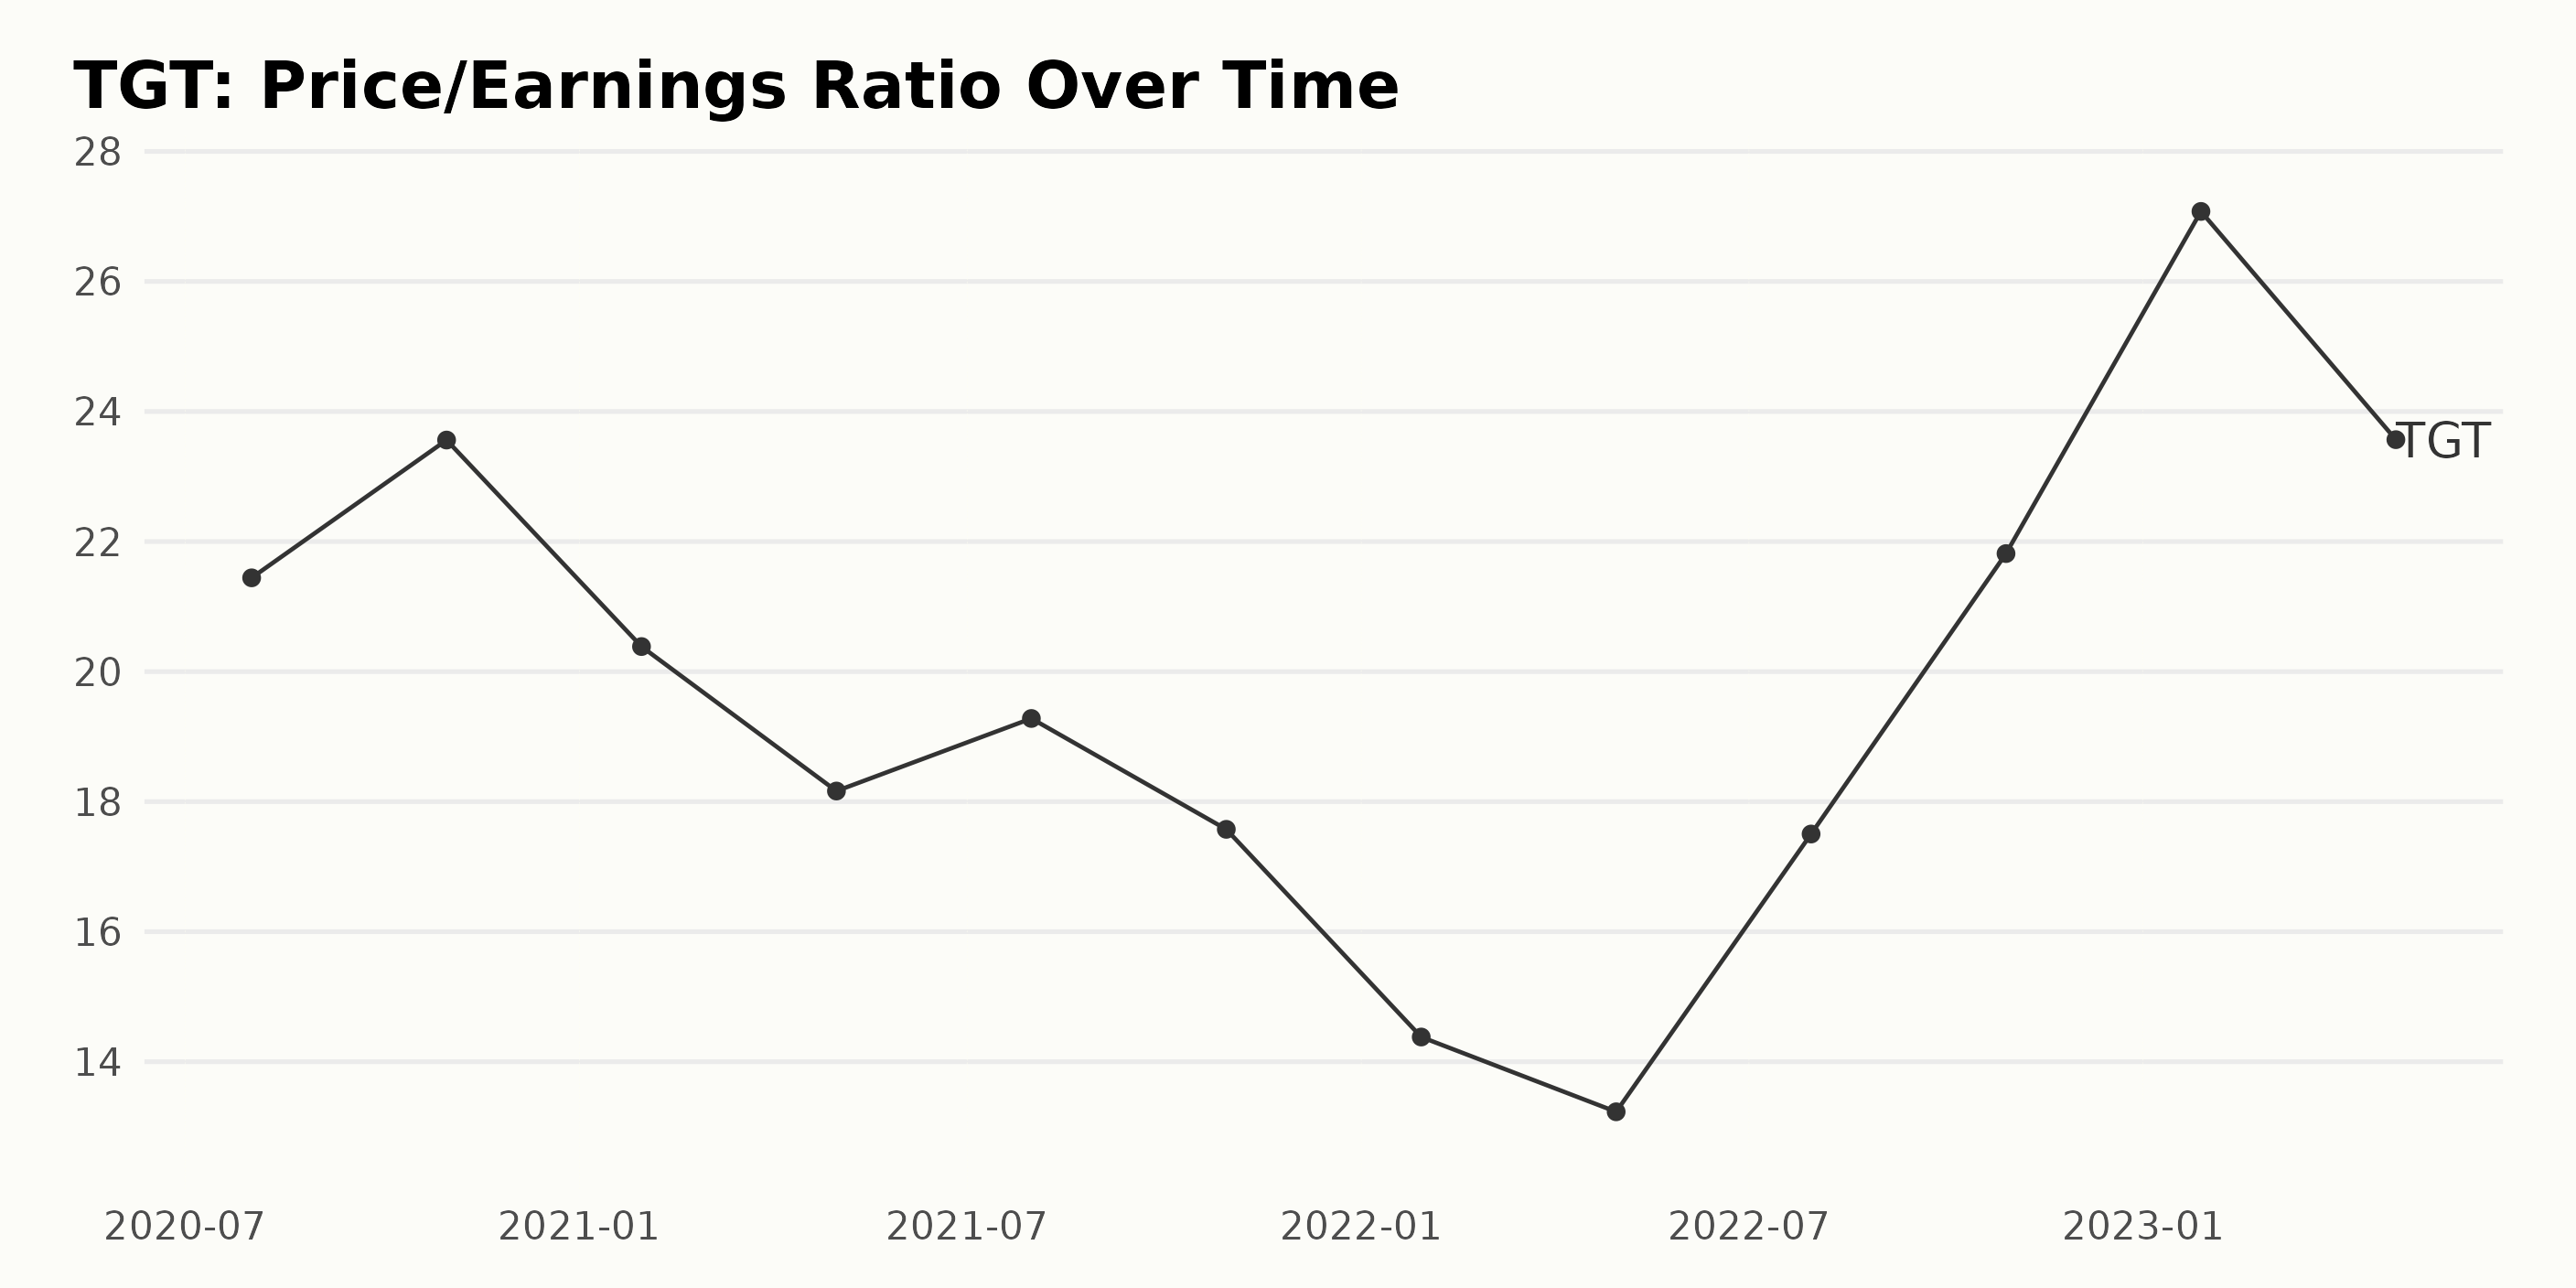
The Price/Earnings (P/E) ratio of TGT has witnessed significant fluctuations throughout the considered period.
- Starting at 21.44 on August 1, 2020, the P/E ratio had an upward surge to reach 23.56 by October 31, 2020, marking a positive trend.
- However, this was followed by a drop, with P/E falling to 20.38 by January 30, 2021, and further down to 18.16 by May 1, 2021. This represented a slight downward phase in the ratio's progress.
- The P/E continued to fluctuate, reaching 19.28 by July 31, 2021, but then fell to its lowest point, 13.23, by April 30, 2022.
- In a regained upward momentum, the P/E spiked to 27.08 by January 28, 2023, its highest value in the series, before reducing marginally to 23.57 by April 29, 2023.
In terms of the growth rate measured from the first value to the last, P/E increased by approximately 10%, indicating an overall increase despite the fluctuations. This increased growth rate, combined with the more recent upward trend since 2022, suggests an improving financial performance outlook for TGT as of late.
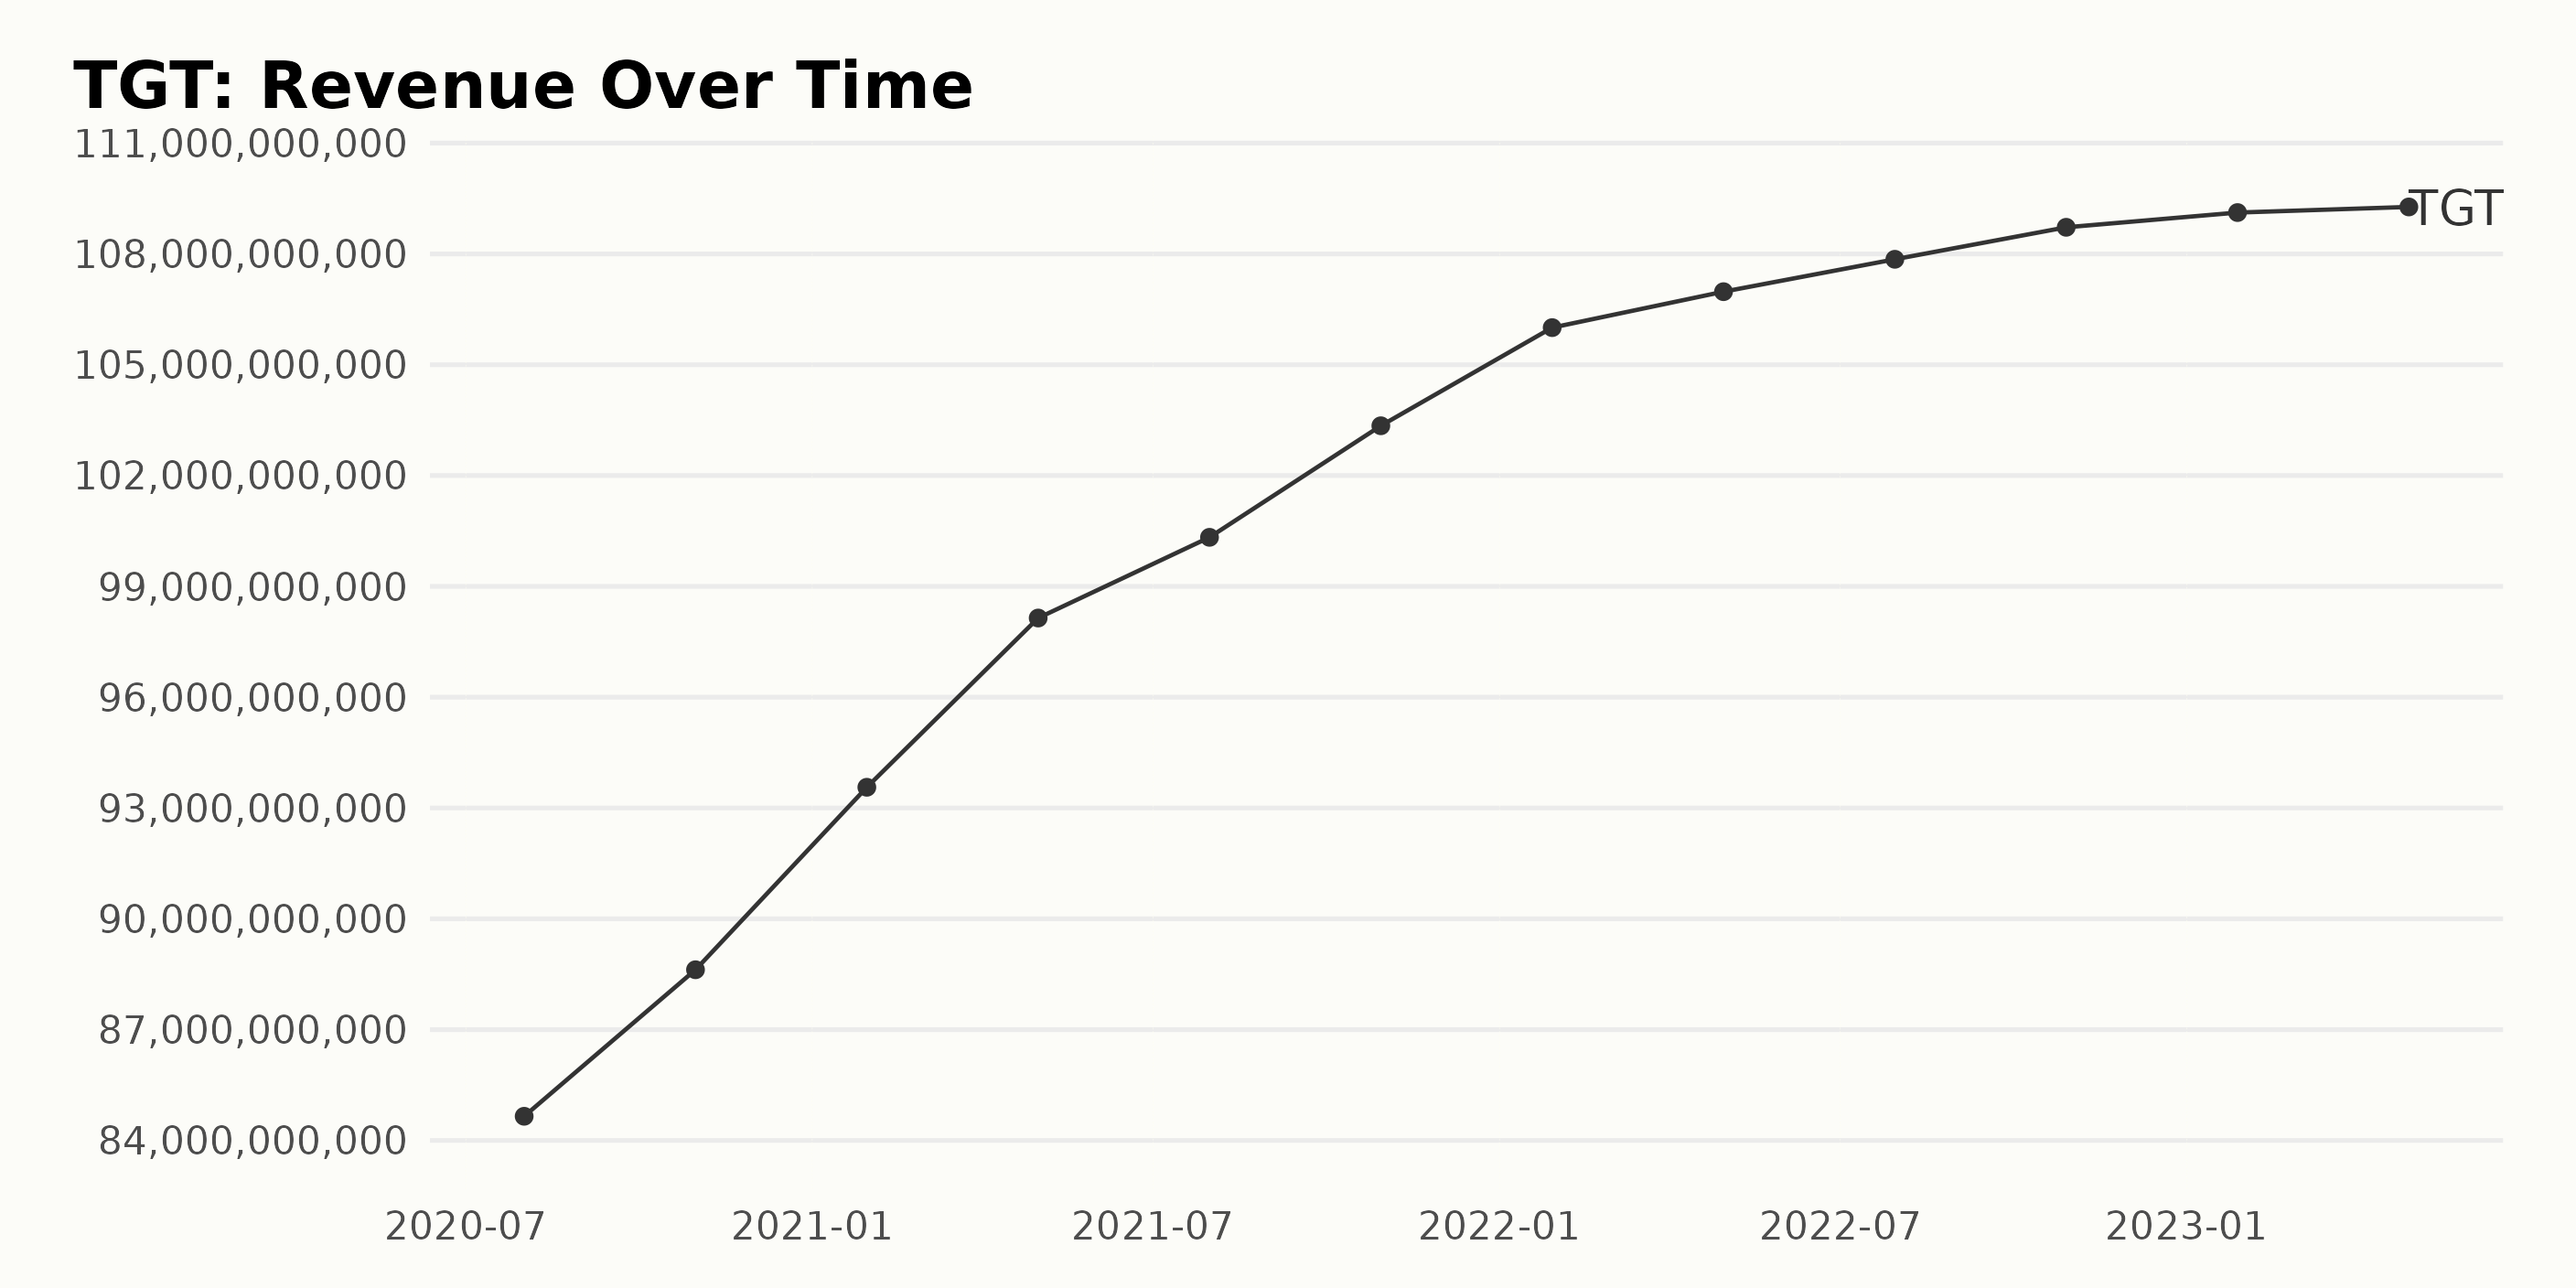
TGT’s trailing-12-month revenue has shown a consistent upward trend over recent years. An overview of this trend is as follows:
- August 2020: $84.65 billion
- October 2020: $88.62 billion
- January 2021: $93.56 billion
- May 2021: $98.14 billion
- July 2021: $100.33 billion
- October 2021: $103.35 billion
- January 2022: $106.01 billion
- April 2022: $106.98 billion
- July 2022: $107.86 billion
- October 2022: $108.72 billion
- January 2023: $109.12 billion
- April 2023: $109.27 billion
Comparing the revenue from August 2020 ($84.65 billion) to the last value in the series in April 2023 ($109.27 billion), the revenue growth rate is approximately 29.1%. Even though TGT experienced numerous fluctuations, the general trend of its revenue successively increased. This represents a continuous positive development in TGT's fiscal performance.
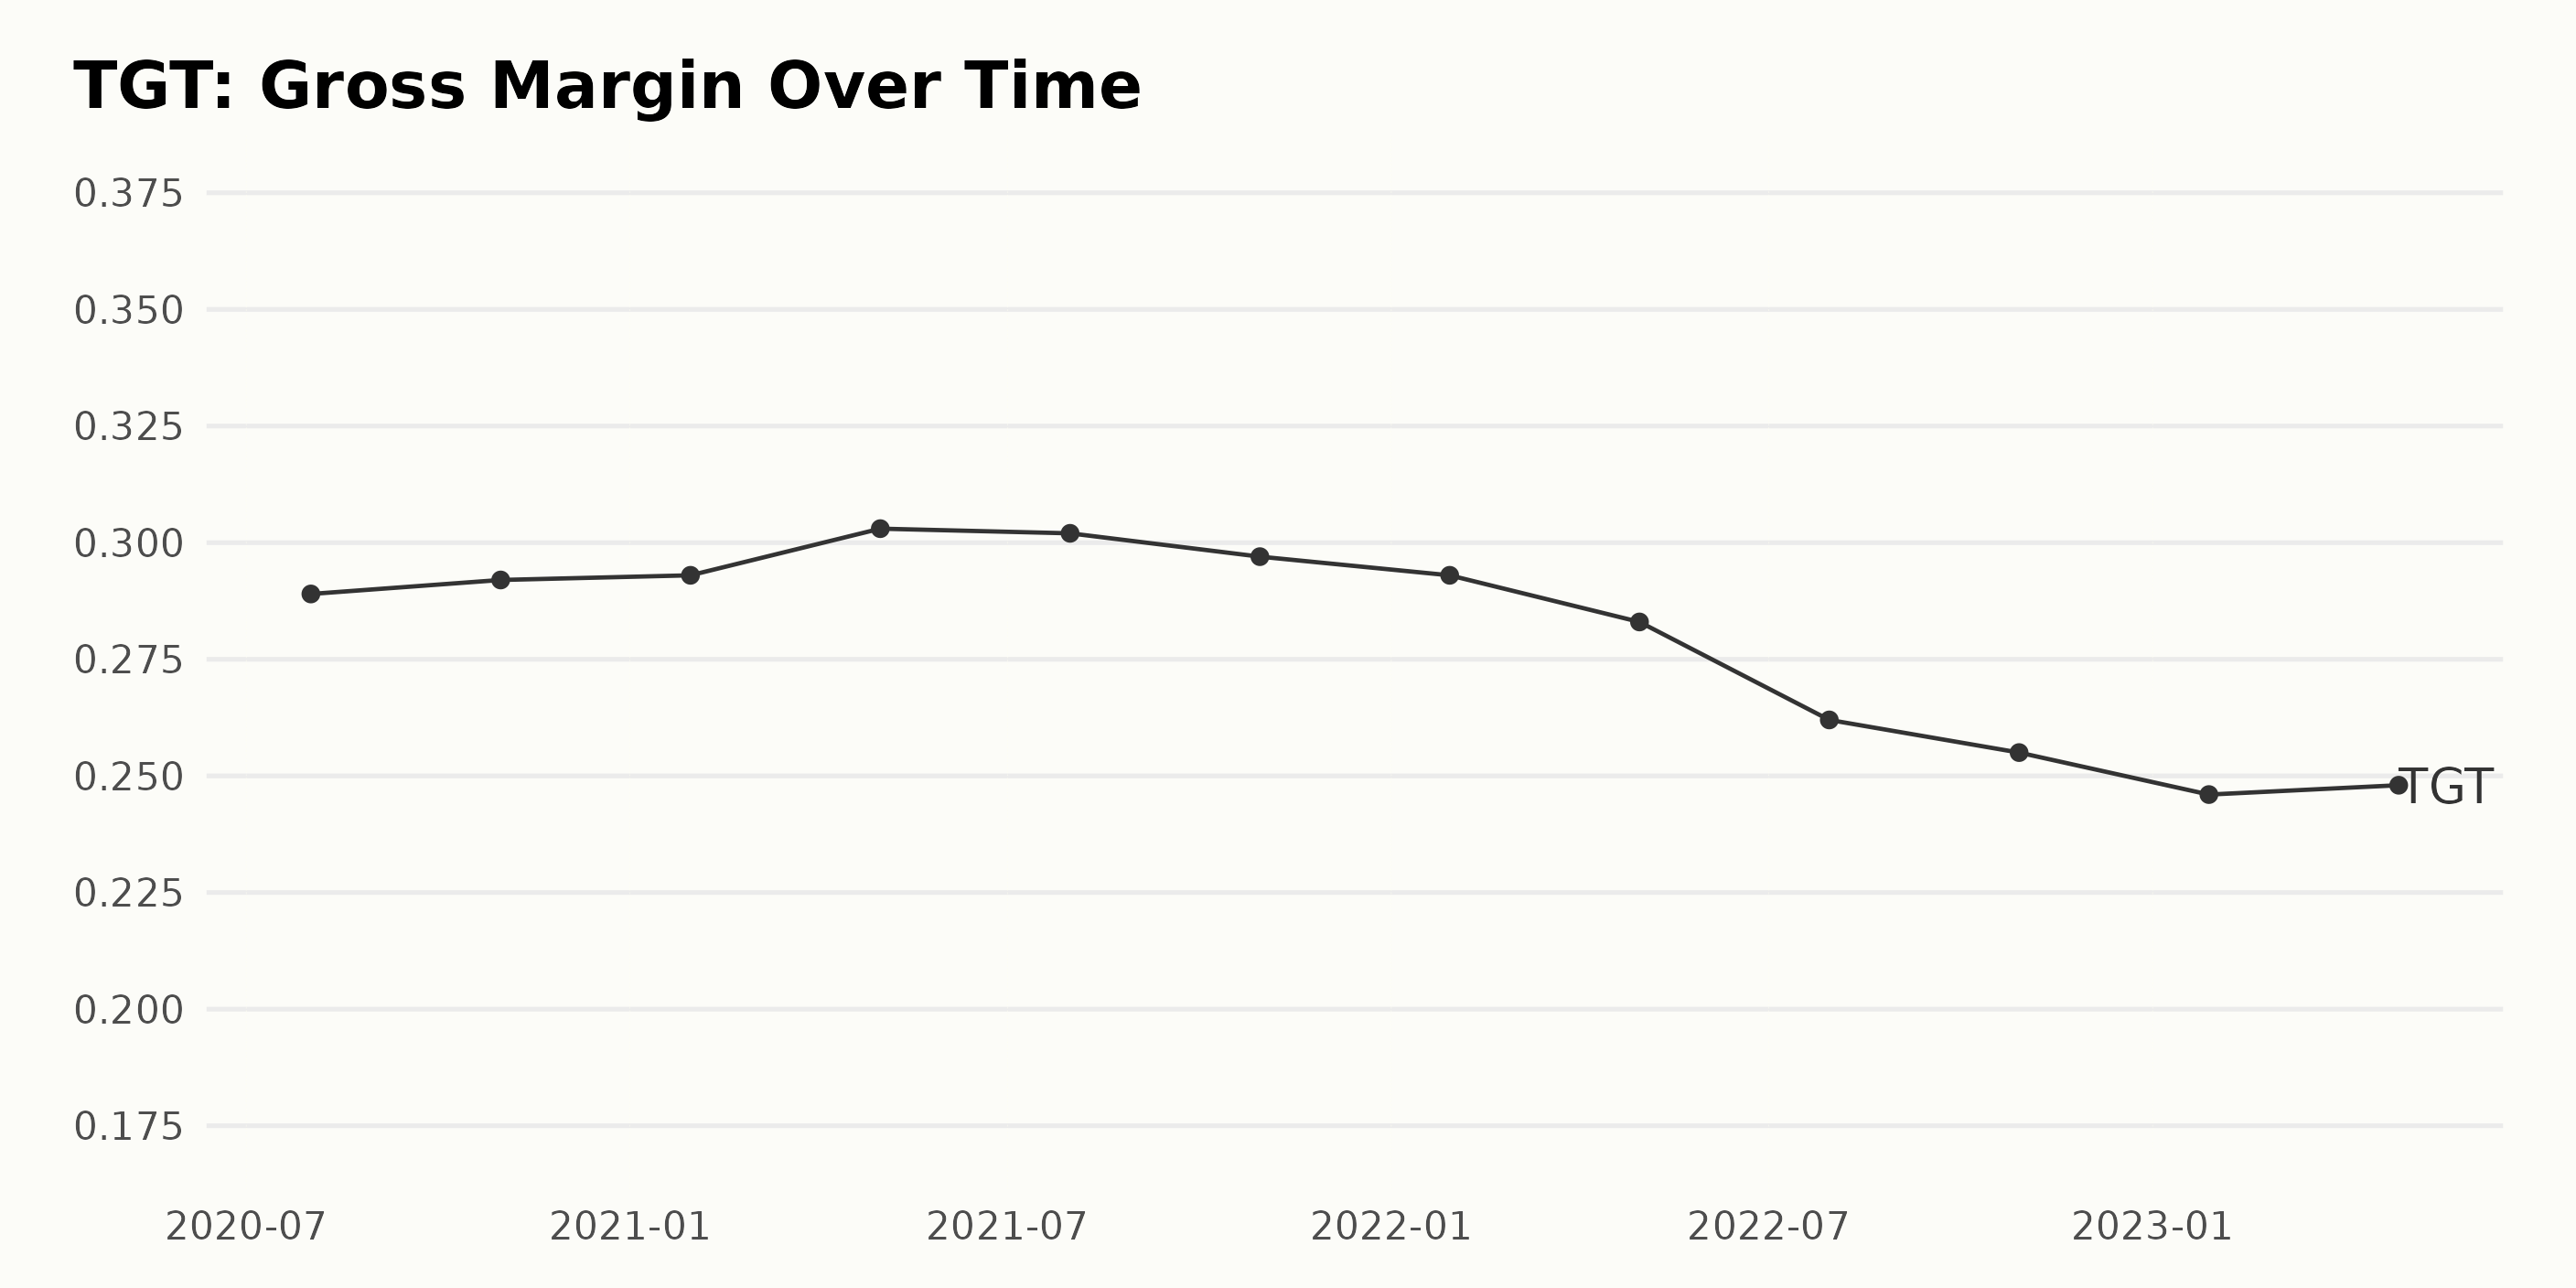
The following data presents the trend and fluctuations in TGT’s gross margin from August 2020 to April 2023:
- August 2020: 28.9%
- October 2020: 29.2%
- January 2021: 29.3%
- May 2021: 30.3%
- July 2021: 30.2%
- October 2021: 29.7%
- January 2022: 29.3%
- April 2022: 28.3%
- July 2022: 26.2%
- October 2022: 25.5%
- January 2023: 24.6%
- April 2023: 24.8%
Overall, TGT’s gross margin has shown a downward trend with fluctuation from August 2020 to April 2023. Even though a peak was reached in May 2021 at 30.3%, it has declined from 28.9% in August 2020 to 24.8% in April 2023.
Since October 2022, the gross margin has hovered around mid-20s percentages, reaching its lowest in January 2023 (24.6%) and showing a slight recovery by April 2023 (24.8%). This reveals a challenge for TGT to maintain its gross margin in recent years.
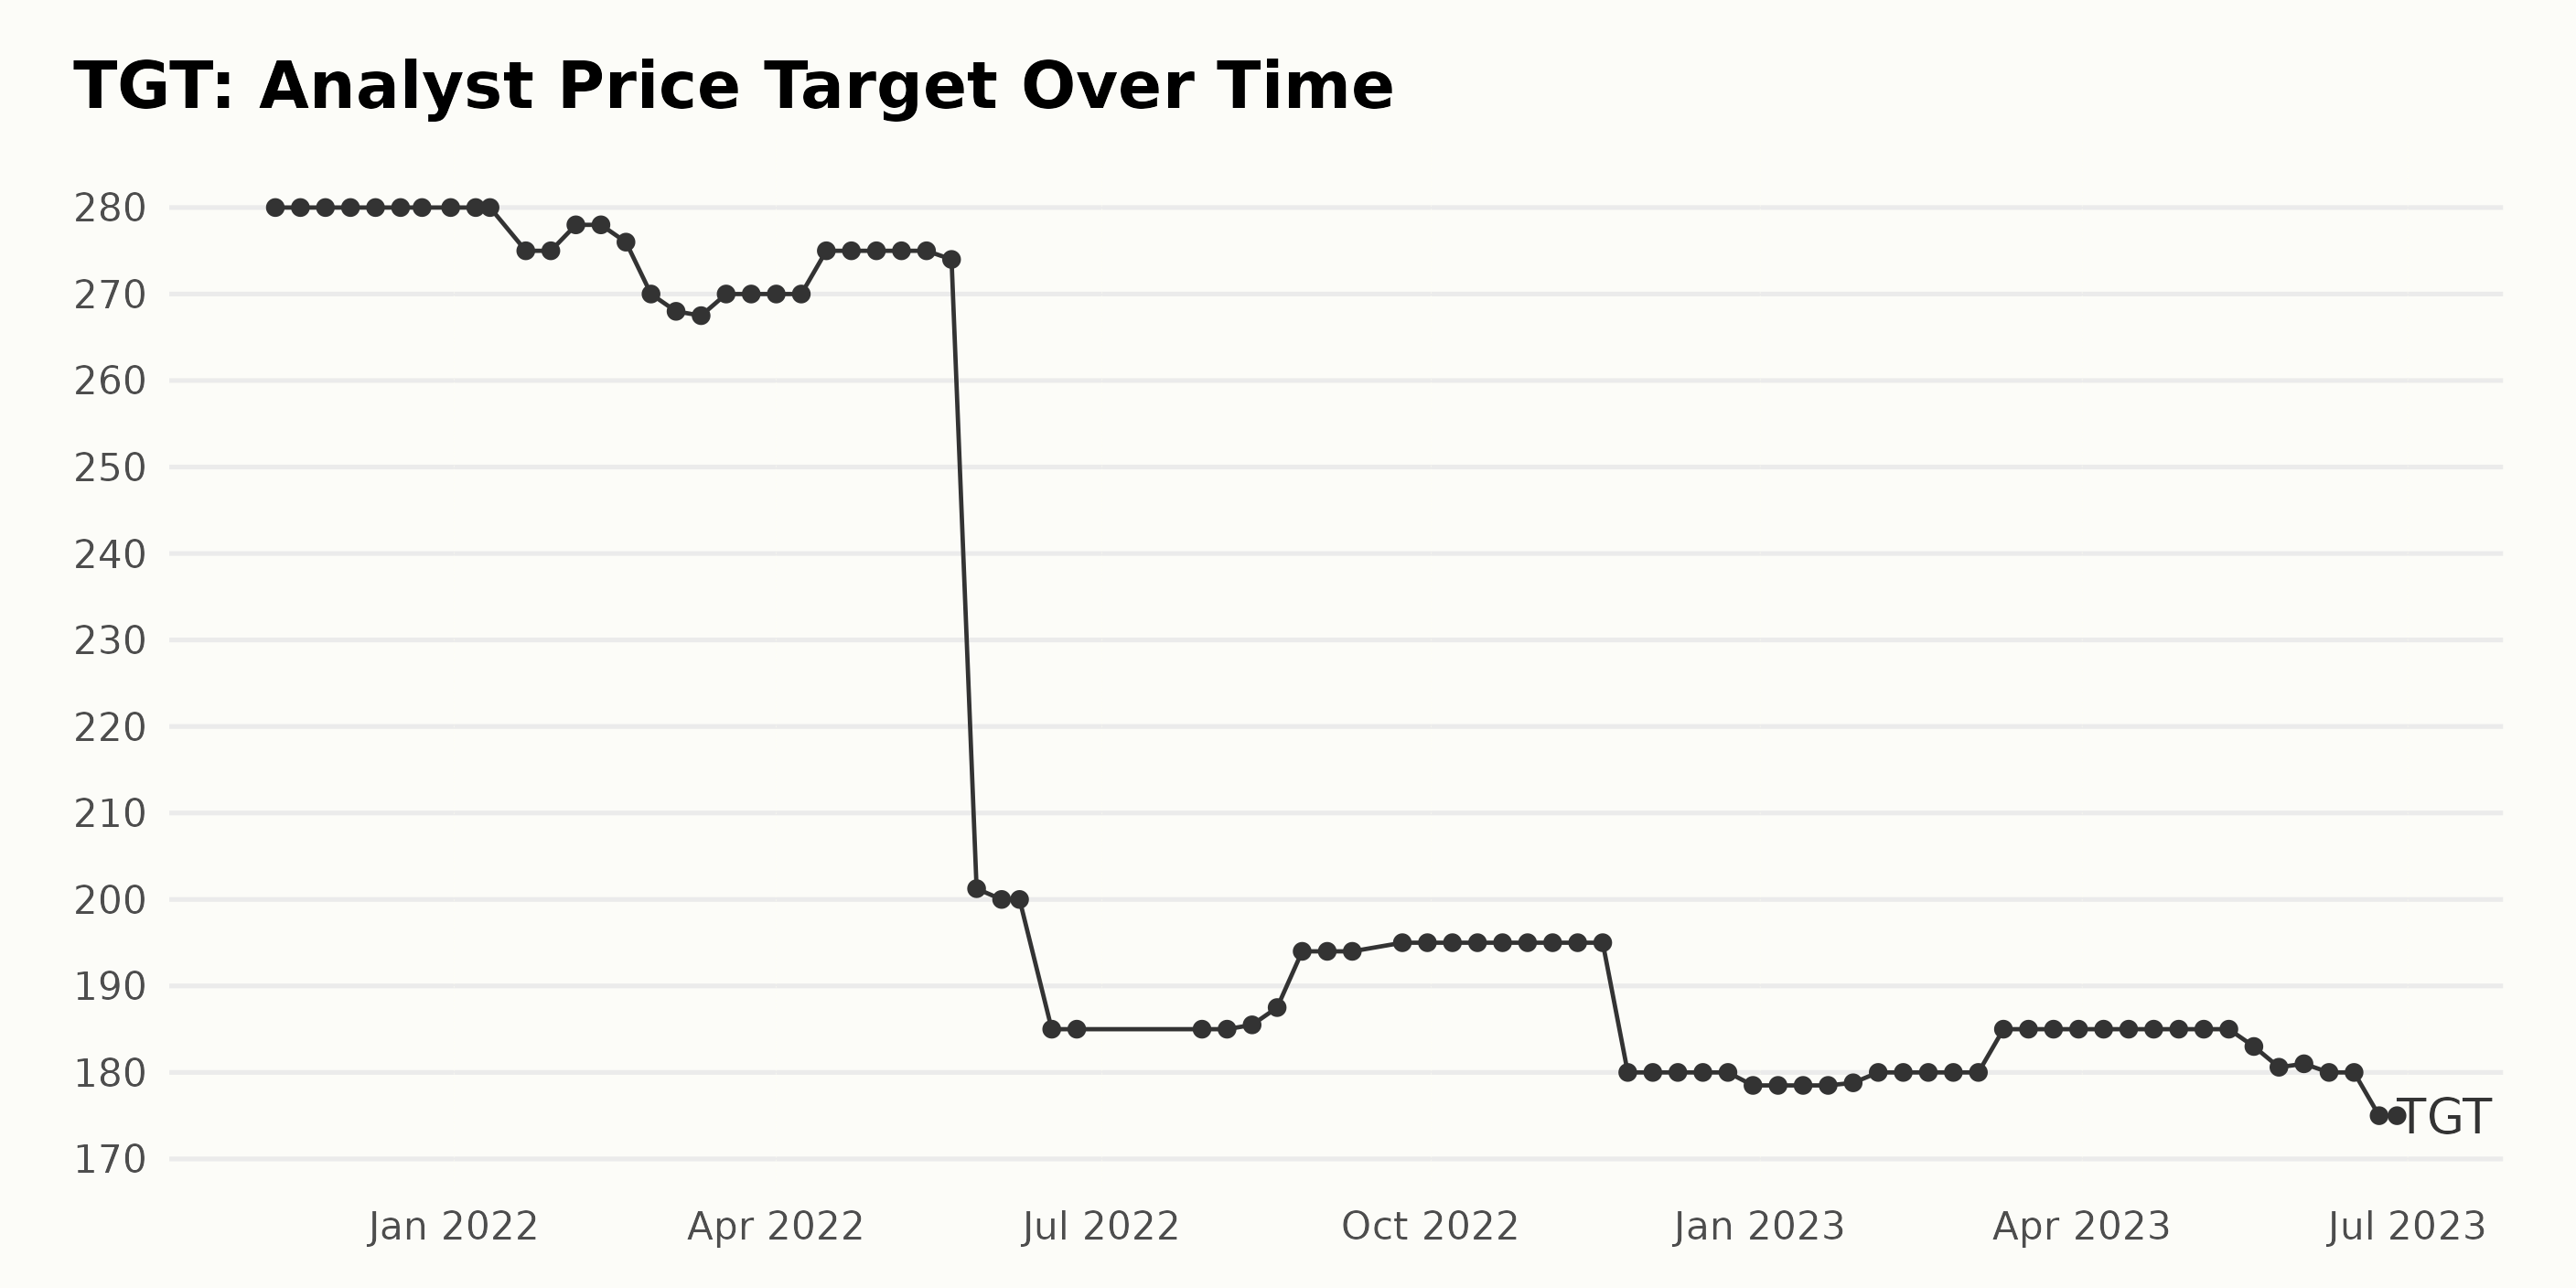
TGT’s analyst price target data shows a general downward trend over the last few years. Notably:
- Starting from $280 in November 2021, the price target held steady until January 21, 2022, before experiencing its first drop to $275.
- This figure fluctuated within a narrow range between $275 and $280 until May 20, 2022, and by the end of May 2022, the target had dropped to $201.25.
- The trend maintained a progressive downward adjustment until November 2022, reaching a low of $180.
- From December 2, 2022, to April 2022, the price target displayed moderate fluctuations, hovering between $178.5 and $180.
- A mild rise was observed on March 10, 2023, increasing the target to $185, but this upward adjustment was short-lived as it declined gently to $175 by the end of June 2023.
In conclusion, the data suggest some level of negative sentiment about TGT's financial outlook over the period between November 2021 and June 2023. Over the entire period, there has been an overall decline of about 37.5% from $280 to $175.
Specifically, in the more recent records (from January to June 2023), there was a small decrease of approximately 1.4% from the starting point of $178.5 to conclude at $175 in June 2023.
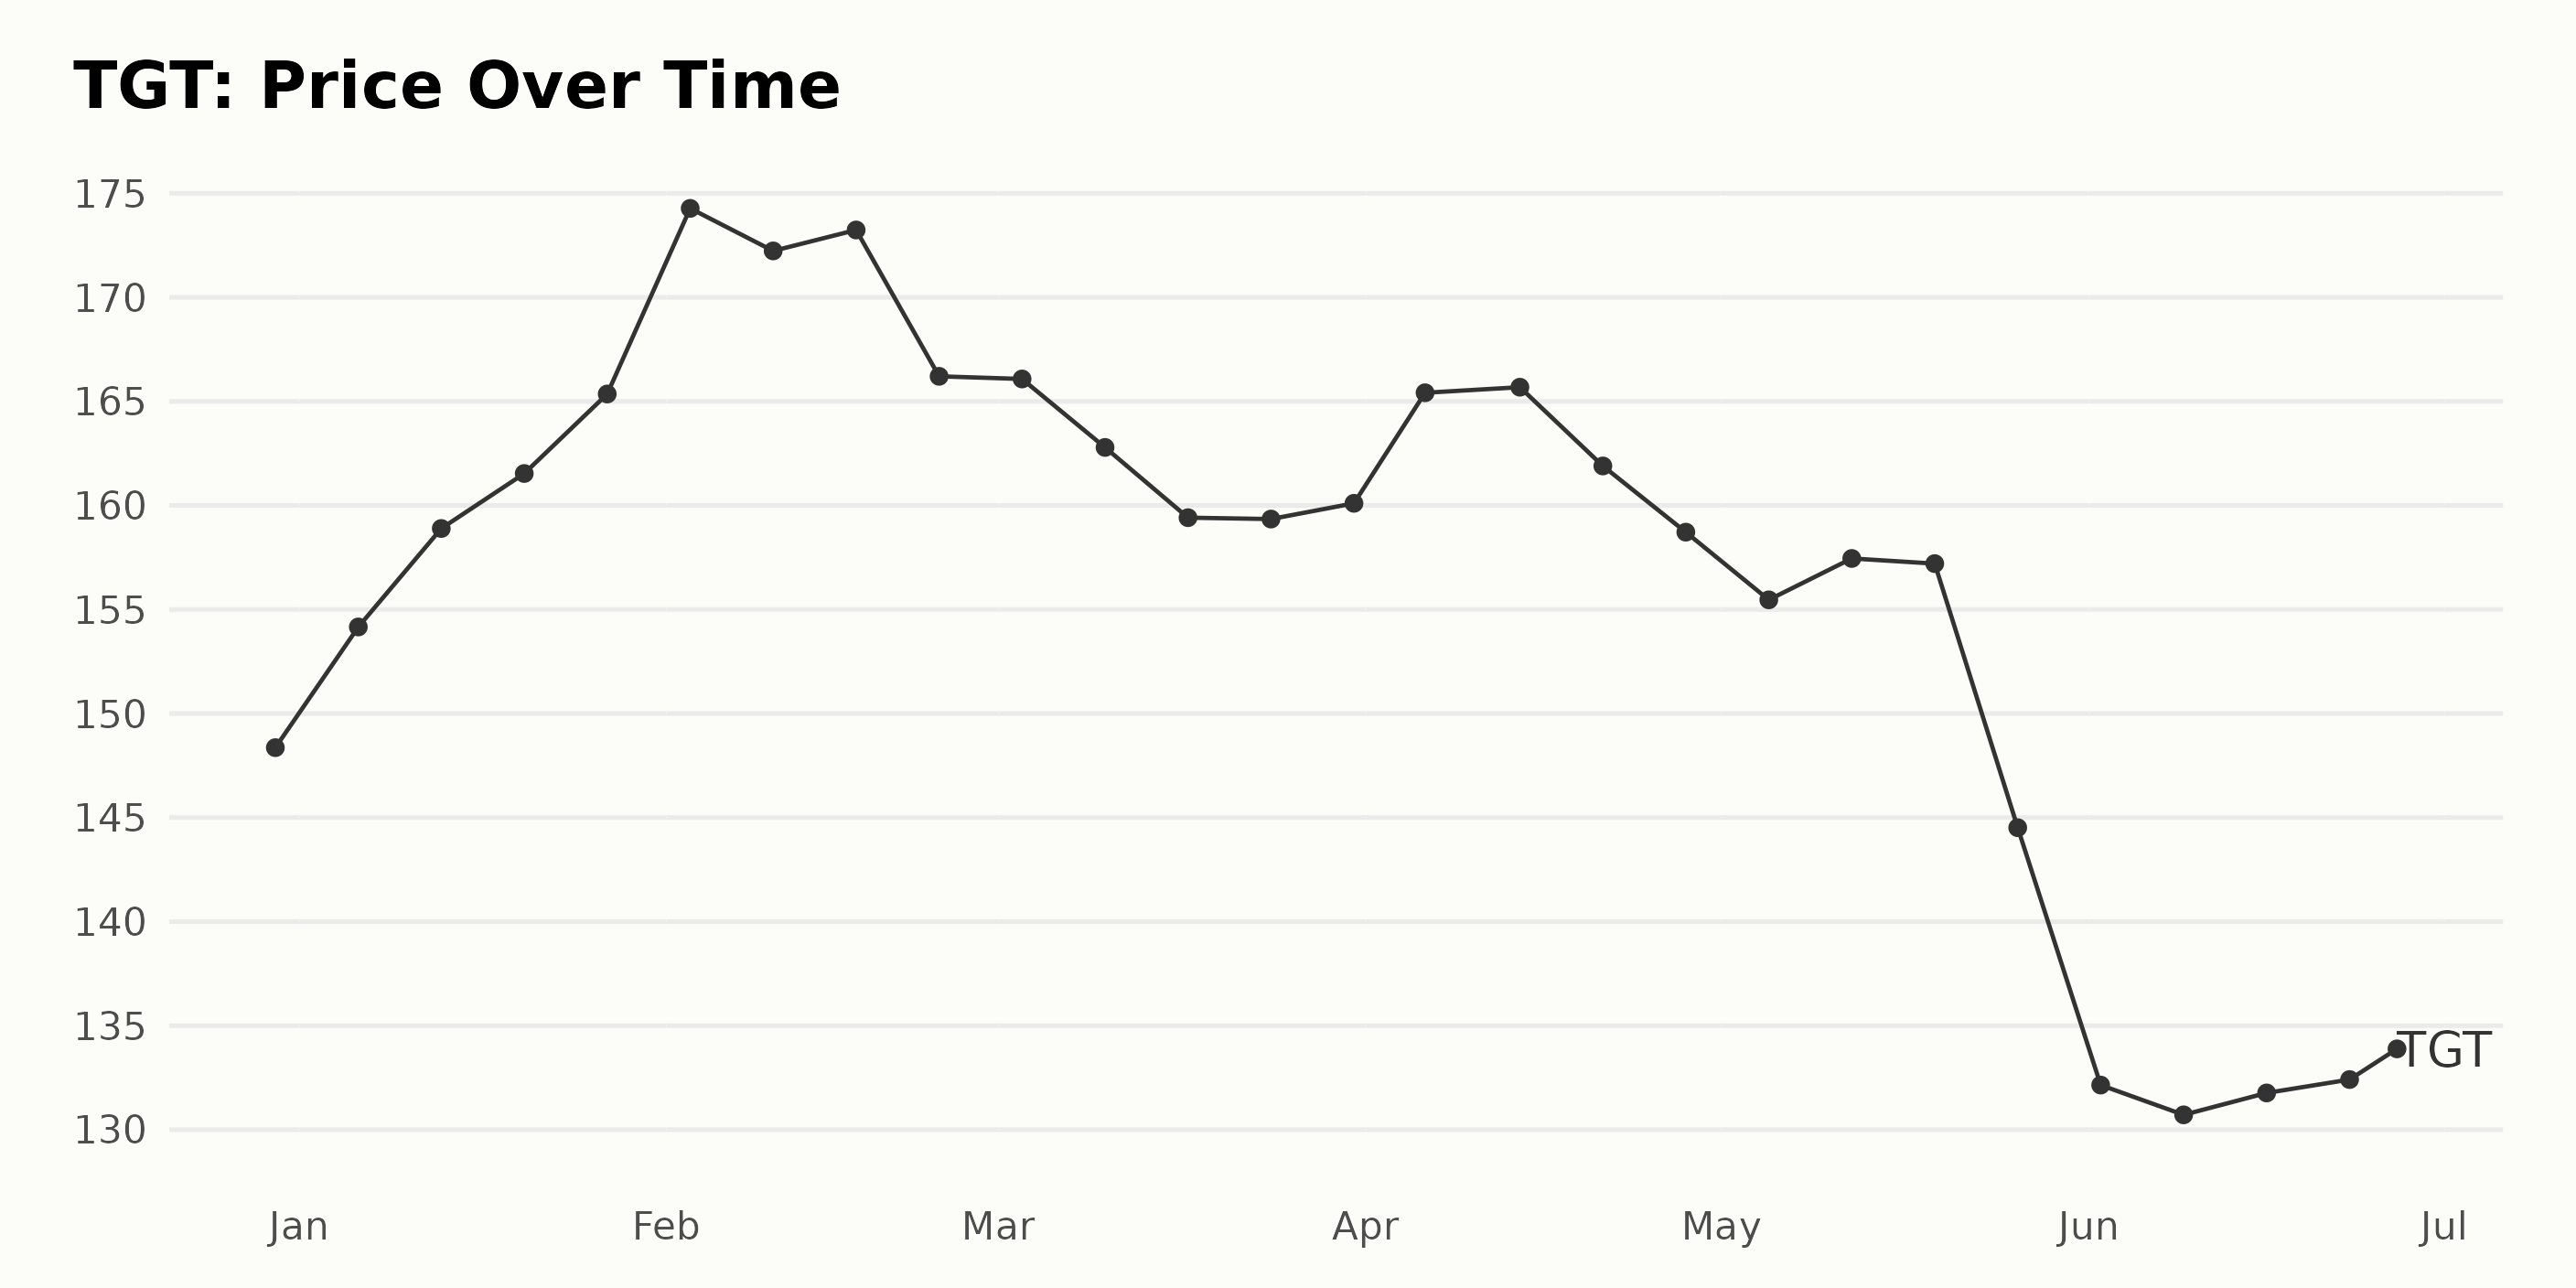
Analyzing Target Corporation’s Share Price Fluctuation from December 2022 to June 2023: Growth, Decline, and Stabilization
The trend and growth rate of the share price of TGT from December 30, 2022, to June 22, 2023, can be summarized as follows:
From December 2022, the share price showed a trend of consistent growth, reaching a peak in February 2023 at $174.28. However, this trend shifted to a slower decline from late February to early April 2023.
Although a slight price rise to around $165 was experienced in early April 2023, a further decline was witnessed from mid-April to May 2023. By late May 2023, it plummeted to $144.51, and a sharp fall was noticed in June 2023.
To summarize, the growth rate of TGT’s share price initially accelerated positively in the first two months of the period, then decelerated sharply by late May and finally stalled around the lower $130s in June. These trends show periods of both growth and fall within a span of six months. Here is a chart of TGT's price over the past 180 days.
Analyzing TGT’s POWR Ratings: Trends in Value, Quality, and Growth
The overall POWR Ratings grade of TGT in the A-rated Grocery/Big Box Retailers category has shown consistent performance across several weeks. As of the latest available data on June 28, 2023, TGT’s overall POWR Ratings grade is a C, equating to Neutral, with its rank in the category being #28 out of 38 stocks.
Here is the summary of the TGT’s POWR grade and rank in the category over the mentioned period:
- December 31, 2022 - POWR grade: C; Ranking in category: #36
- February 18, 2023 - POWR grade: C; Ranking in category: #34
- March 25, 2023 - POWR grade: C; Ranking in category: #29
- May 20, 2023 - POWR grade: C; Ranking in category: #31
- June 28, 2023 - POWR grade: C; Ranking in category: #28
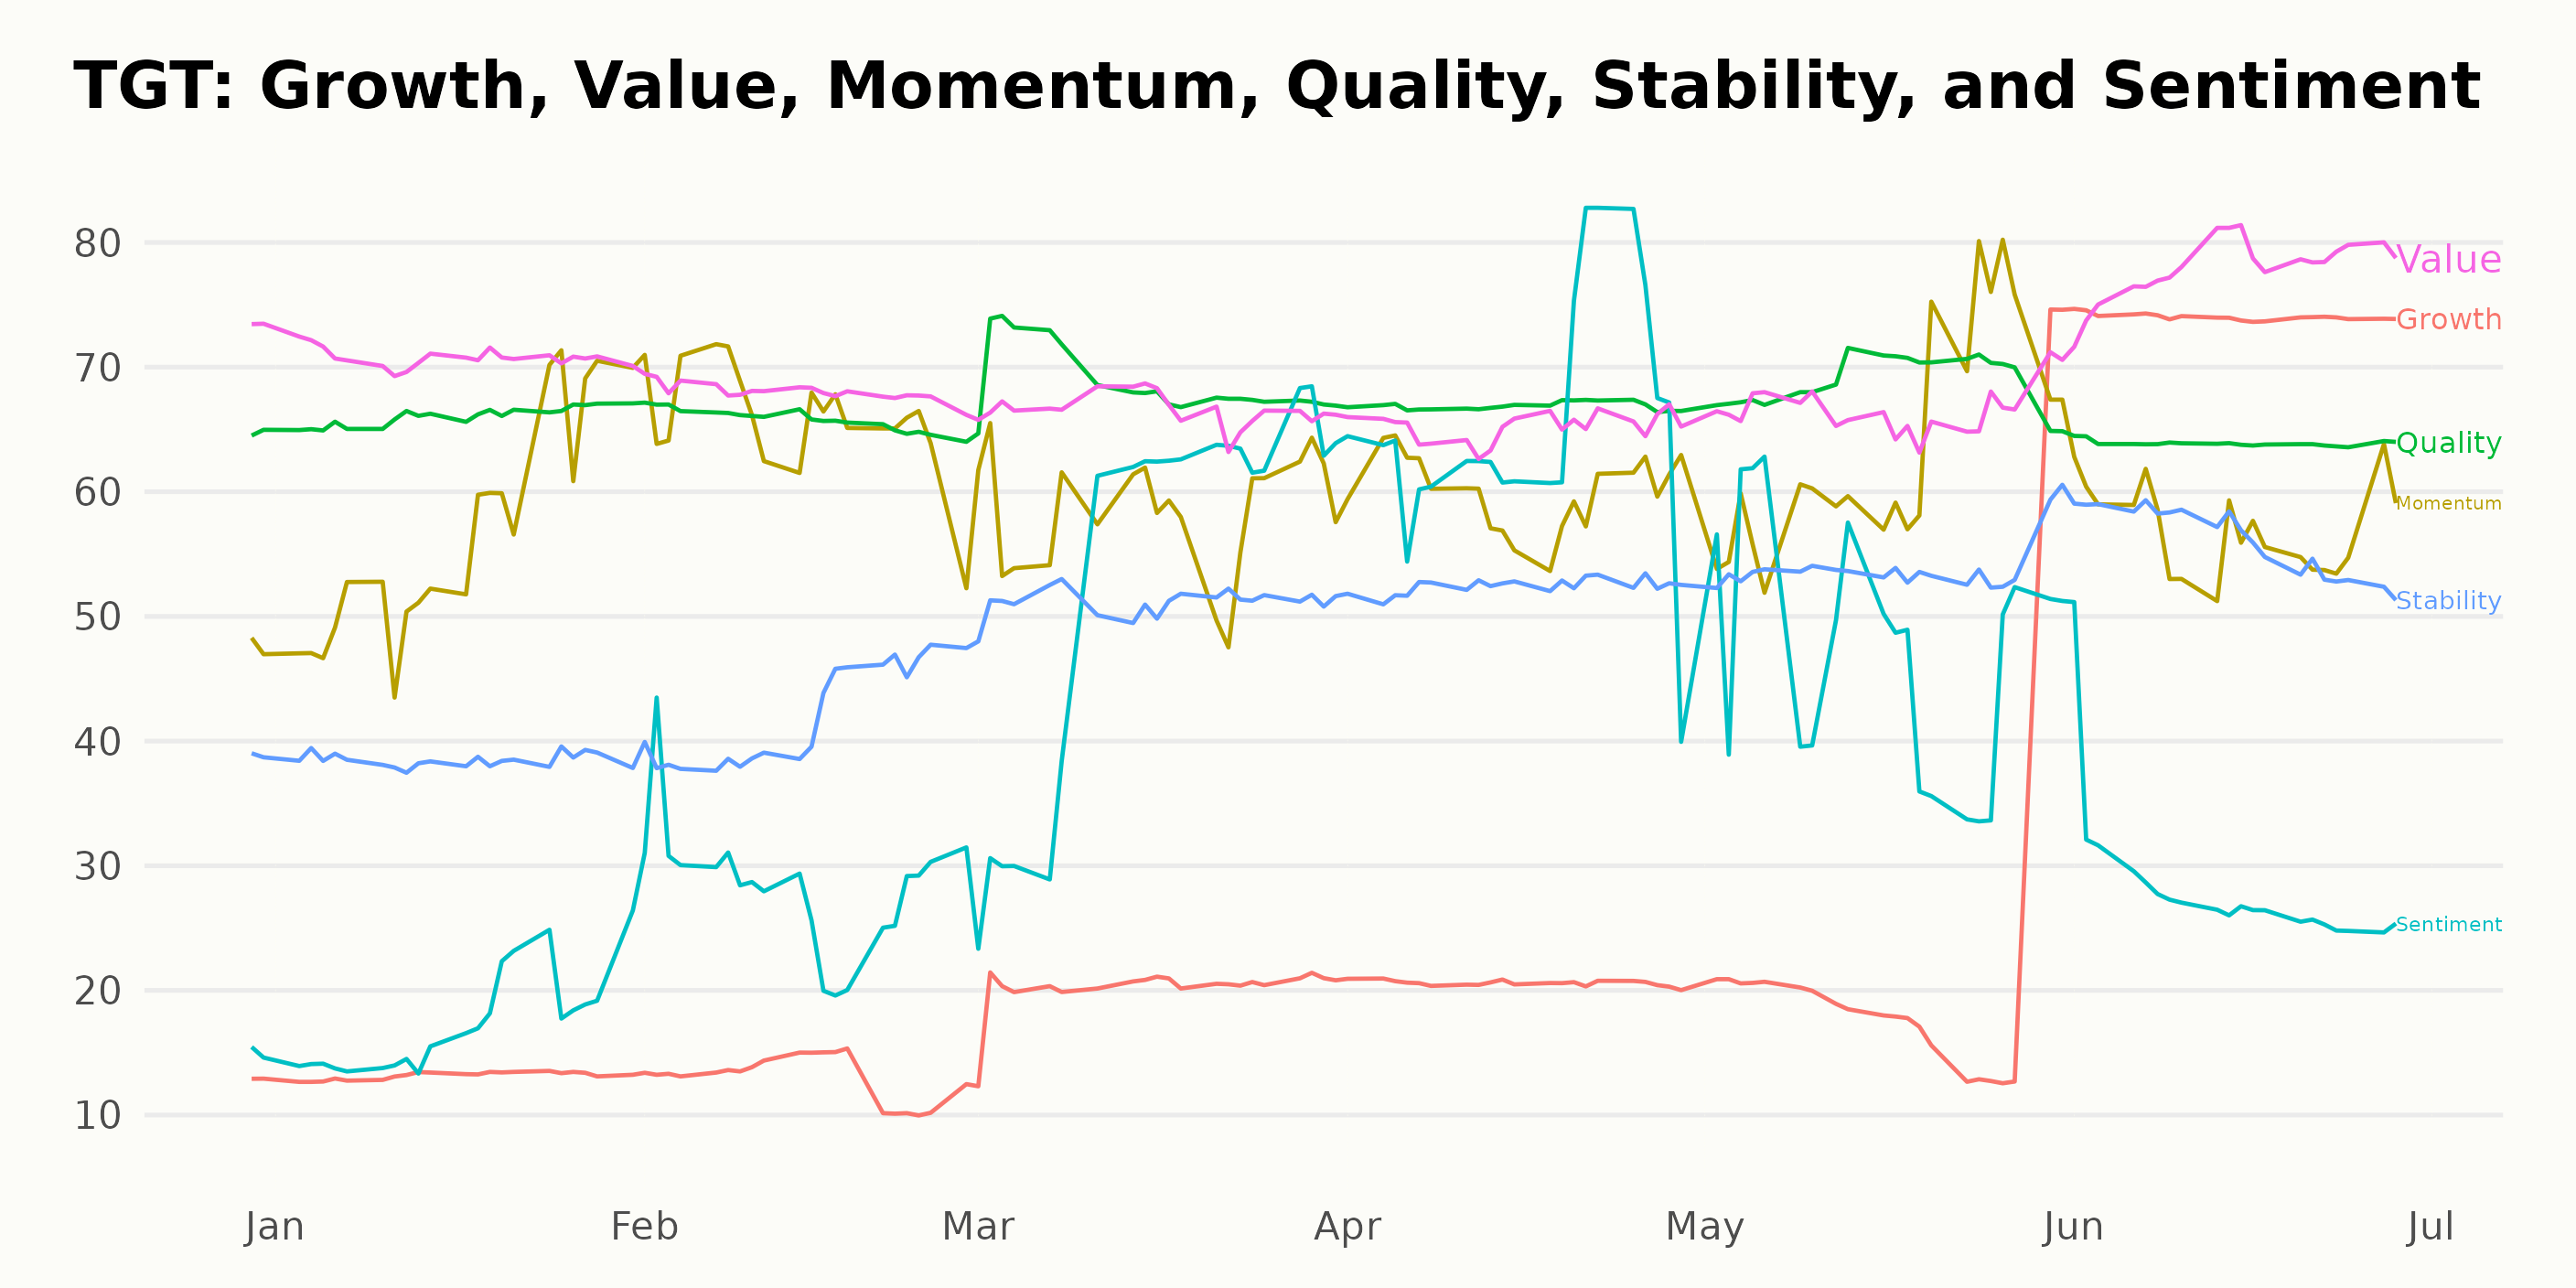
The POWR Ratings for TGT showcase its performance along six dimensions. Among these, the three most noteworthy dimensions are Value, Quality, and Growth. The highest rating TGT received is in the Value dimension. A breakdown of these dimensions over time is as follows:
Value:
- December 2022: 73
- June 2023: 78
Quality:
- December 2022: 65
- March 2023: 69
- June 2023: 64
Growth:
- December 2022: 13
- June 2023: 74
In conclusion, while Value remains the standout dimension, the ratings along with Quality remain strong yet stable, and Growth shows promising momentum upwards. These patterns reflect positively on TGT.
How does Target Corporation (TGT) Stack Up Against its Peers?
Other stocks in the Grocery/Big Box Retailers sector that may be worth considering are Village Super Market, Inc. (VLGEA), PriceSmart, Inc. (PSMT), and Natural Grocers by Vitamin Cottage, Inc. (NGVC) - they have better POWR Ratings.
What To Do Next?
Get your hands on this special report with 3 low priced companies with tremendous upside potential even in today’s volatile markets:
3 Stocks to DOUBLE This Year >
TGT shares were trading at $133.07 per share on Wednesday afternoon, up $0.56 (+0.42%). Year-to-date, TGT has declined -9.55%, versus a 14.62% rise in the benchmark S&P 500 index during the same period.
About the Author: Sristi Suman Jayaswal

The stock market dynamics sparked Sristi's interest during her school days, which led her to become a financial journalist. Investing in undervalued stocks with solid long-term growth prospects is her preferred strategy. Having earned a master's degree in Accounting and Finance, Sristi hopes to deepen her investment research experience and better guide investors.
The post Is Target (TGT) a Value Buy This Week? appeared first on StockNews.com