
General merchandise retailer Target Corporation (TGT) last month declared a 1.9% increase in its quarterly dividend to $1.10 per common share. Its annual dividend of $4.40 yields 3.29% on prevailing prices. Moreover, its dividend has grown at a 17.8% CAGR over the past three years and an 11.7% CAGR over the past five years.
However, in addition to maintaining its full-year profit forecast, TGT expects a wide range of sales outcomes centered around a low-single-digit decline in comparable sales in the second quarter due to sales softening in the first quarter.
Given this backdrop, let’s look at TGT’s key financial metrics trends to understand why it could be wise to wait for a better entry point in the stock.
Examining Target Corporation's Fluctuating Financial Performance from 2020 to 2023
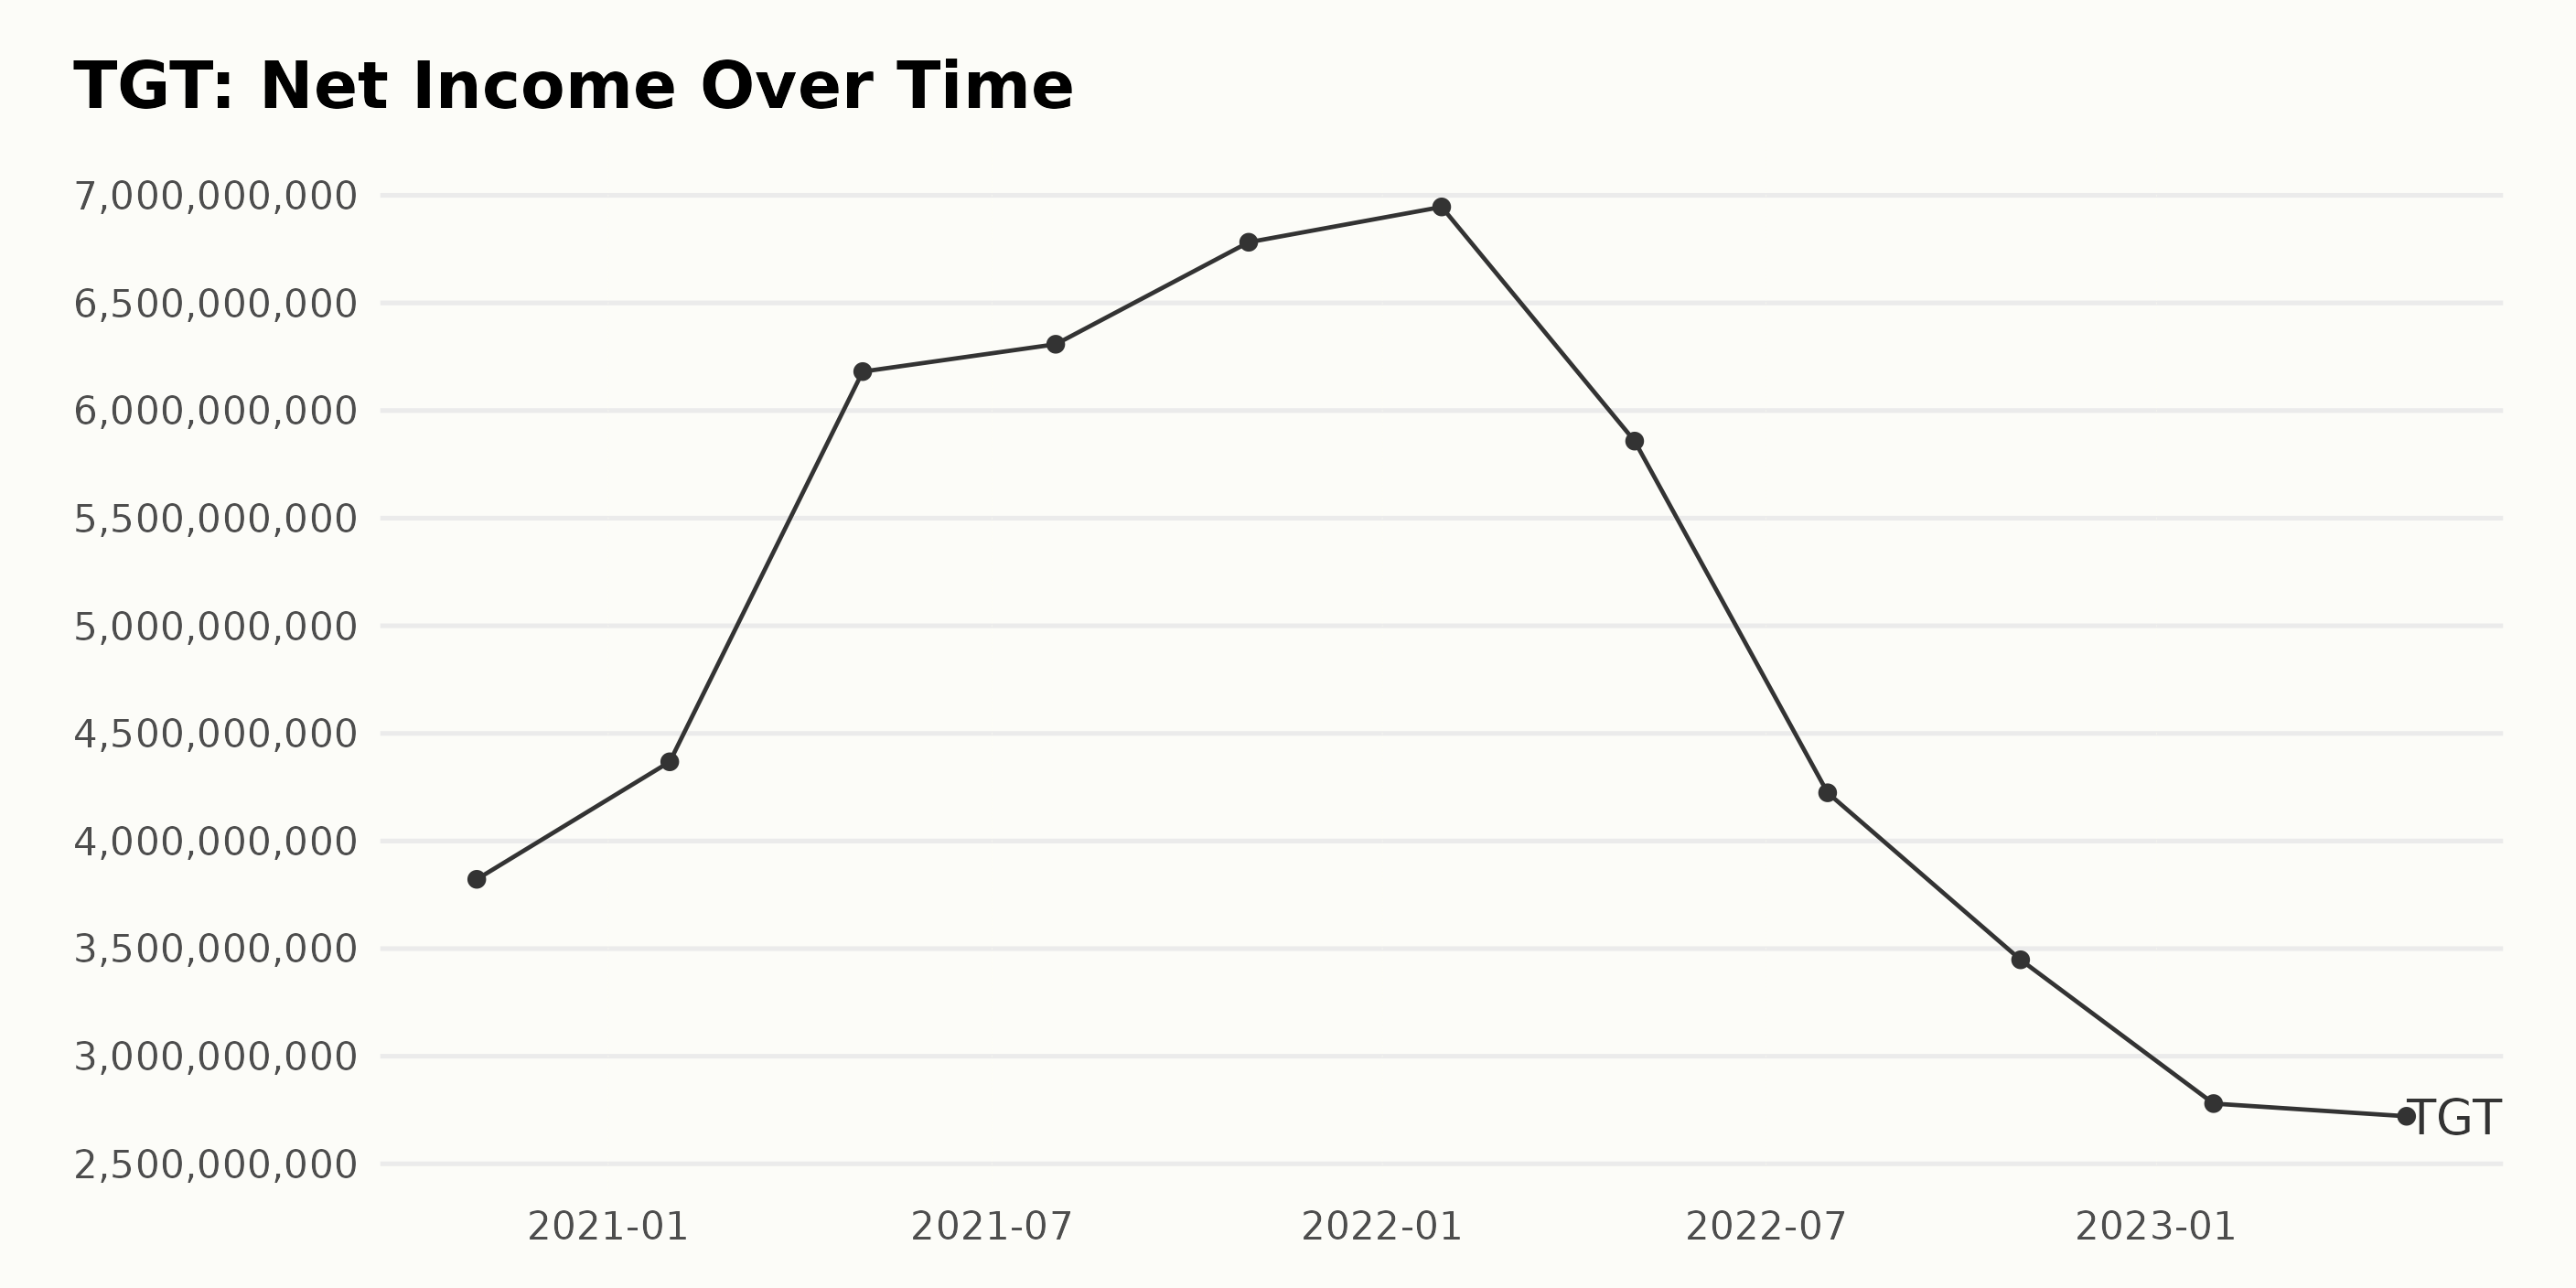
The trend and fluctuations in the trailing-12-month net income of TGT seem significant over the observed period.
- Starting from October 2020, TGT reported a net income of $3.82 billion.
- This increased by January 2021, when we saw a rise to $4.37 billion.
- A noticeable jump is seen by May 2021, with its net income soaring to $6.18 billion.
- The growth trend continued until January 2022, peaking at $6.95 billion.
However, there was a sharp decline in net income for the rest of 2022.
- In April, it reduced to $5.86 billion, followed by $4.22 billion by July, and then further declined to $3.45 billion by October, representing consistent quarter-on-quarter falls during 2022.
In 2023, the net income trend continued to decrease.
- In January 2023, it dropped to $2.78 billion and then slightly decreased to $2.72 billion as of April 2023, showing signs of stabilizing albeit at a lower level than previous years.
Comparing the latest value in the series ($2.72 billion in April 2023) to the first ($3.82 billion in October 2020), there has been a decline in the growth rate of approximately 29%. While initially positive, the overall trend tilted toward a reduction in recent periods.
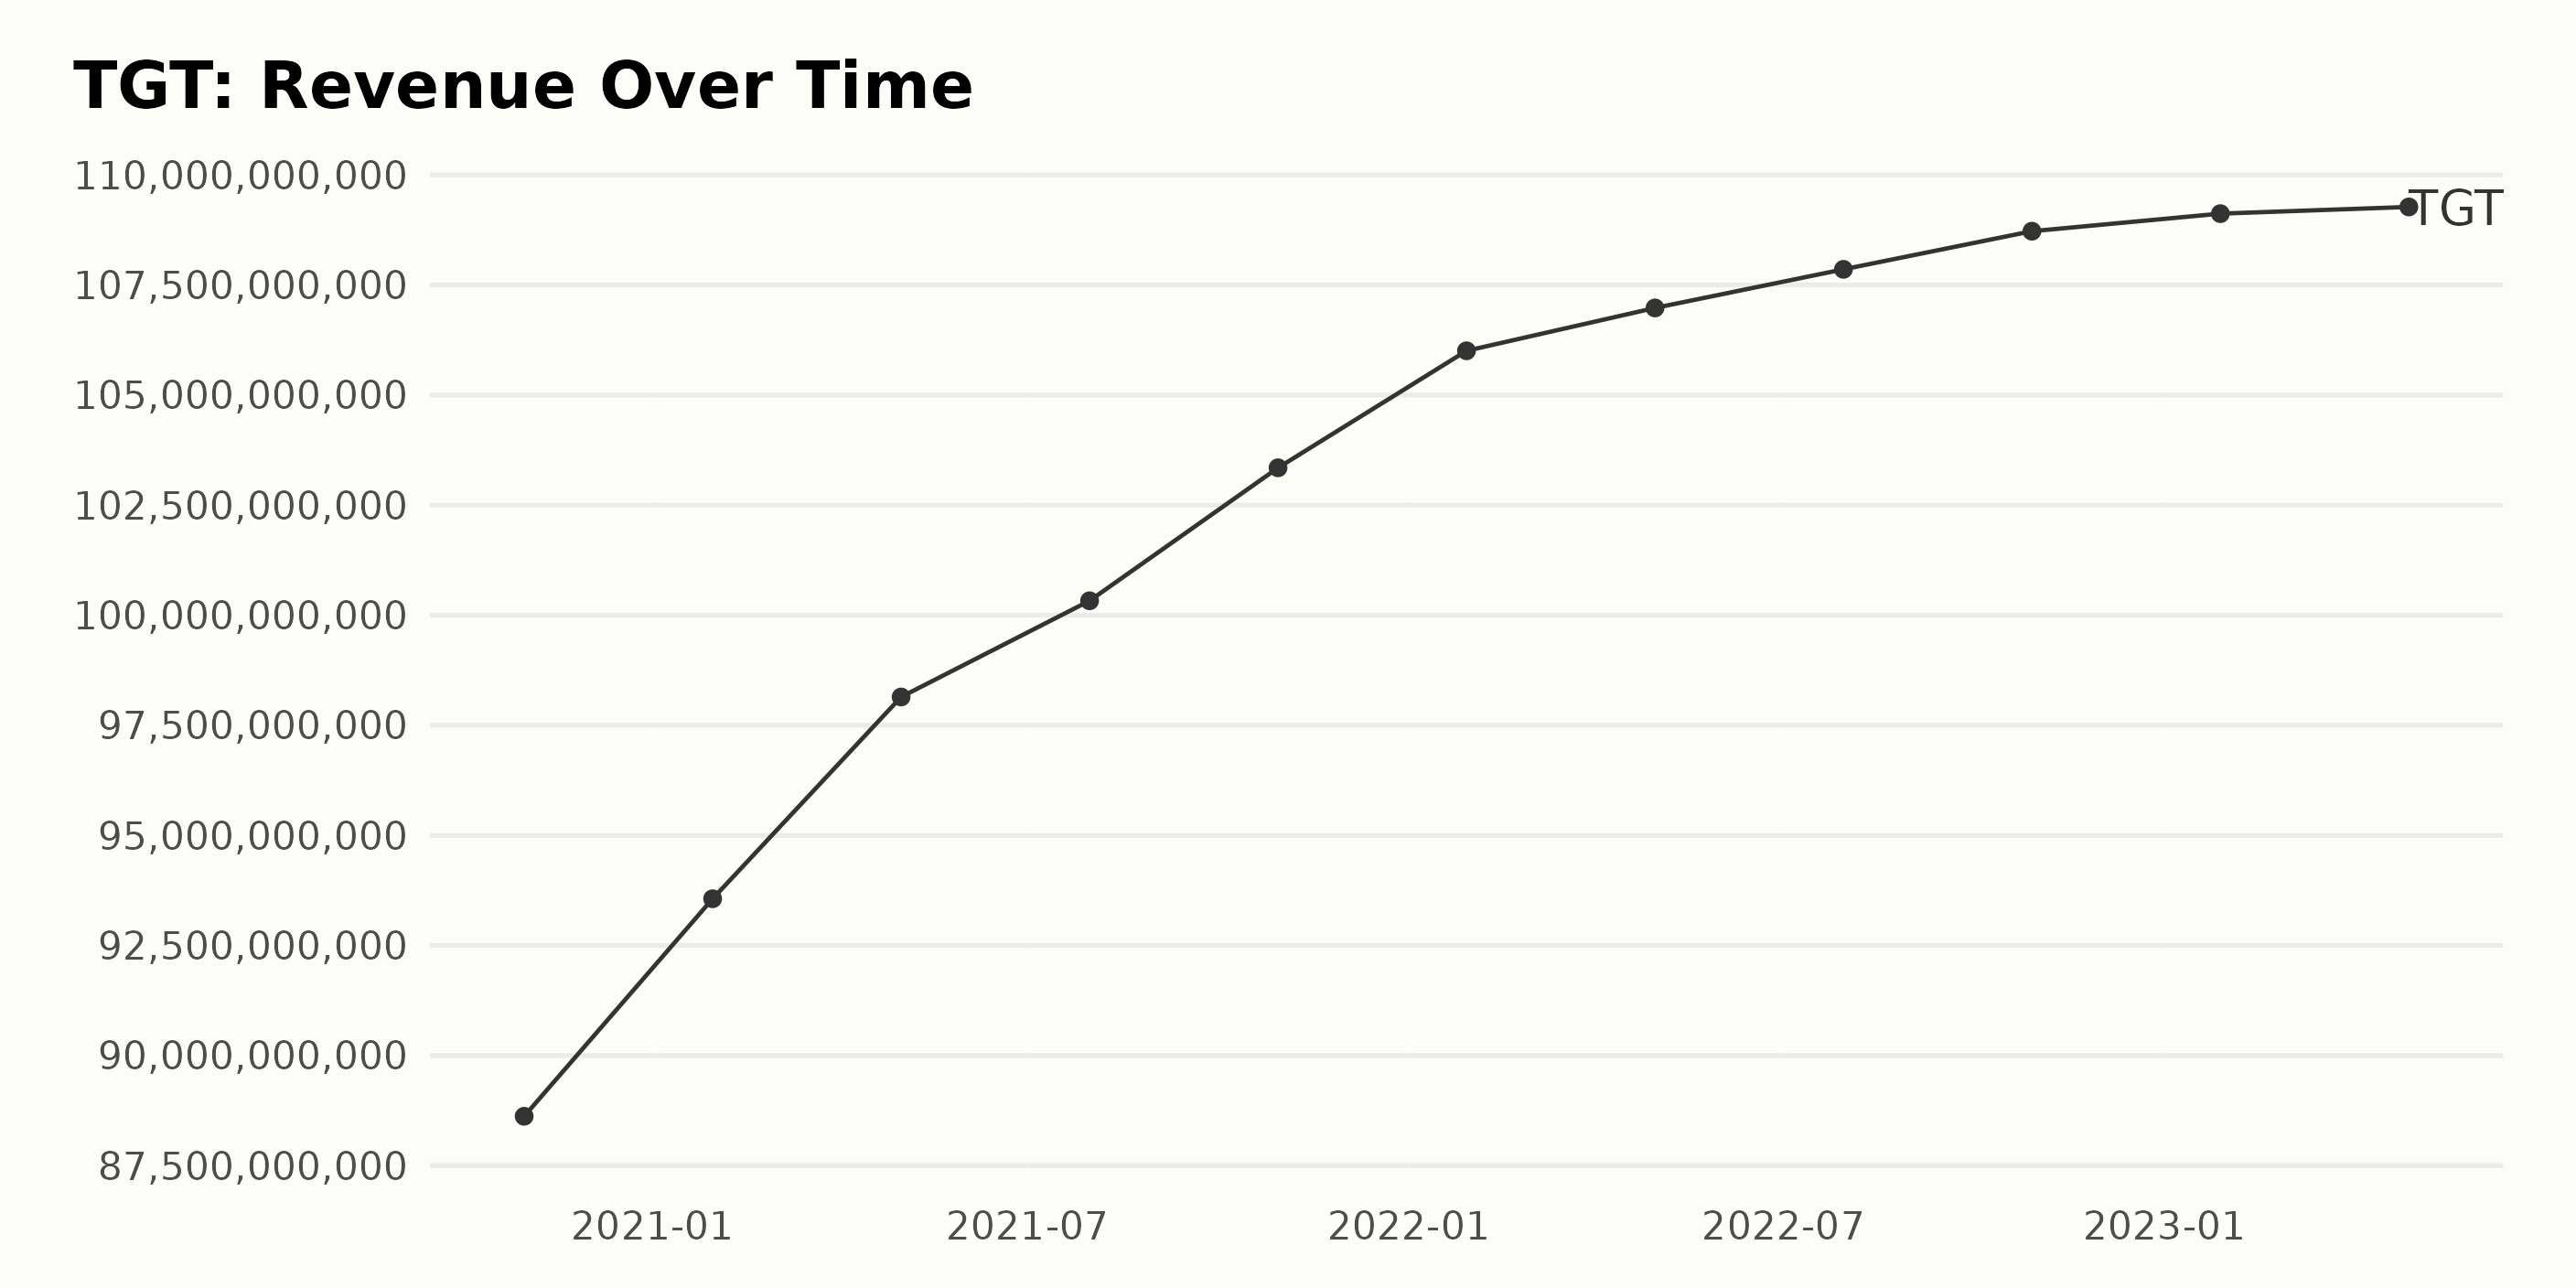
The trailing-12-month revenue of TGT has shown a consistently upward trend over the reported period, with specific periods of accelerated growth followed by relatively more moderate increases. Here's a summary:
- On October 31, 2020, the revenue was $88.62 billion.
- Between October 2020 and January 2021, there was a noticeable surge to $93.56 billion, representing significant growth within these few months.
- From January 2021 to July 2021, the pace of revenue augmentation increased steadily, reaching first $98.14 billion in May 2021 and then $100.33 billion in July 2021.
- By October 30, 2021, the revenue had continued to expand to $103.35 billion.
- The progress pattern from January 2022 onwards displayed a more gradual pace. The revenue peaked at $106.98 billion in April 2022, $107.86 billion in July 2022, and $108.72 billion in October 2022.
- From January 2023 to April 2023, the pace of growth seemed to decelerate moderately, with revenue plateauing somewhat at $109.12 billion in January and $109.27 billion in April 2023.
From the first recorded value of $88.62 billion in October 2020 to the last value of $109.27 billion in April 2023, TGT’s revenue demonstrates an aggregate growth of approximately $20.65 billion, equivalent to a growth rate of about 23.3%. While periods of more accelerated growth were noted, recent data mainly reflected a more measured rate of expansion.
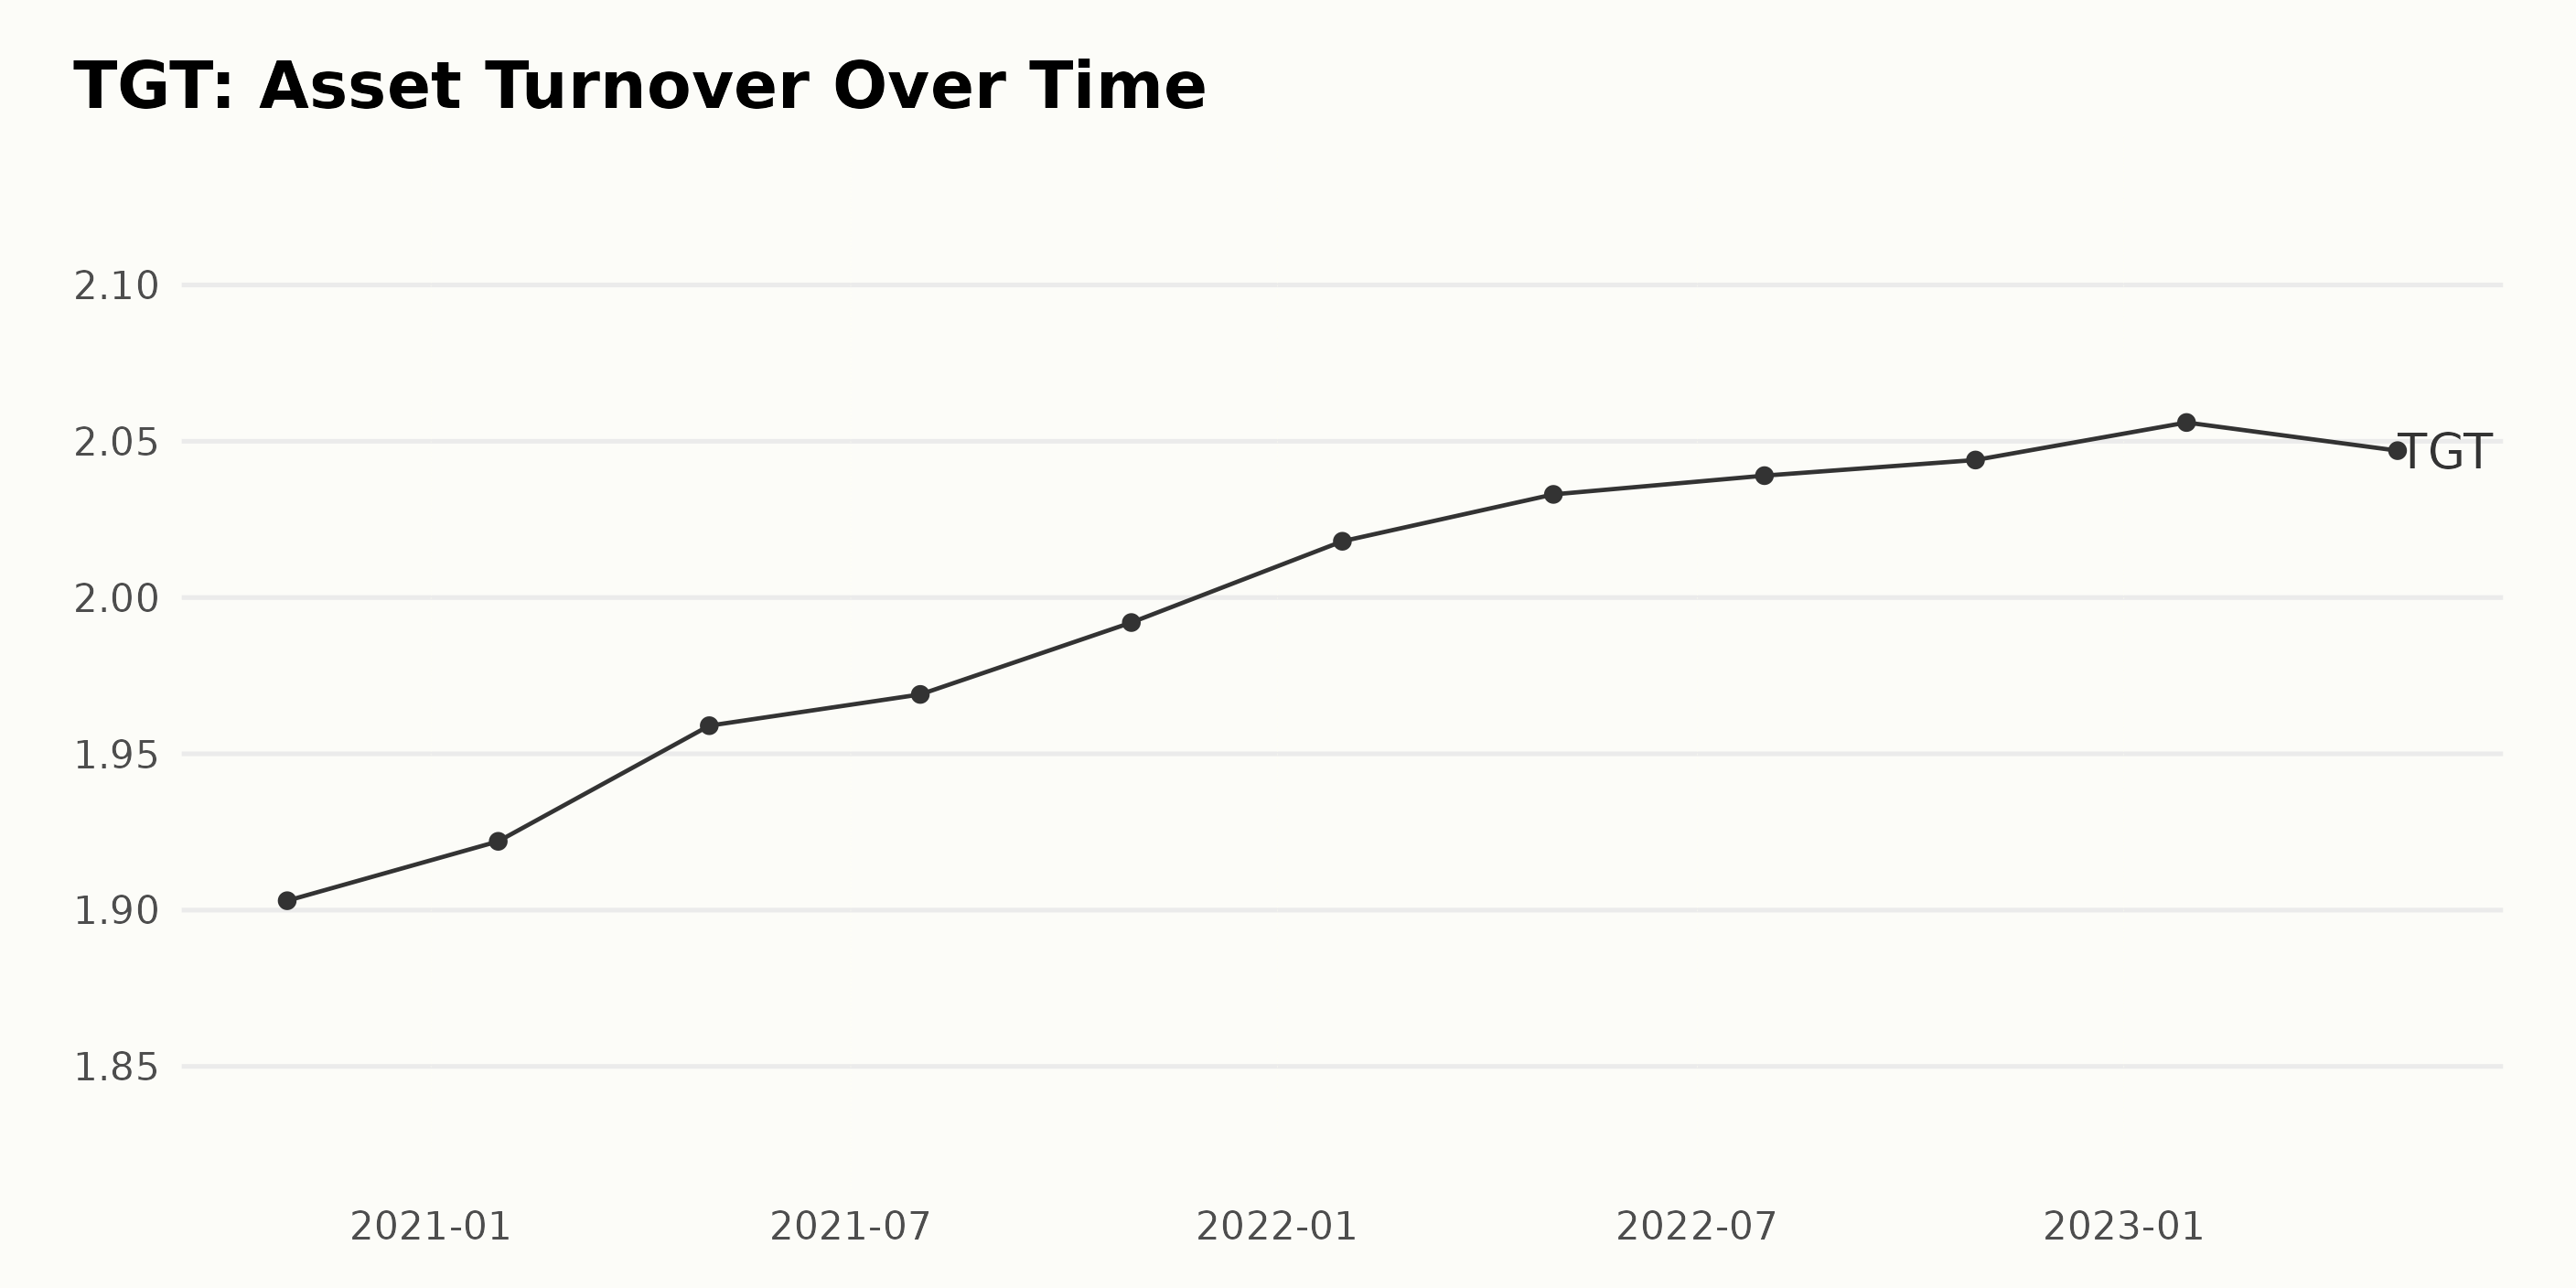
The series represents the asset turnover of TGT over a span of almost three years. Here's a summary of the data as noticed:
- TGT witnessed a gradual increase in asset turnover from October 2020 to April 2023, indicating improved asset efficiency.
- Starting with a value of 1.90 in October 2020, the asset turnover reached its highest at 2.06 by January 2023.
- The series tends to have a slight fluctuation but shows an overall uptrend, with occasional months of no change or slight pullbacks.
- A consistent but slight upward trend was observed from October 2021 to April 2022. After that, the asset turnover remained stagnant until October 2022, showing little to no change.
- The largest positive change was seen between January 2022 to April 2022.
- The first sign of downturn is noted in the last reported period - between January and April 2023, when the asset turnover value fell from 2.056 to 2.047.
We can calculate the percentage growth by comparing the first and last values in the series. The asset turnover has grown from 1.903 to 2.047 from October 2020 to April 2023. This represents a growth rate of approximately 7.57% over roughly three years.
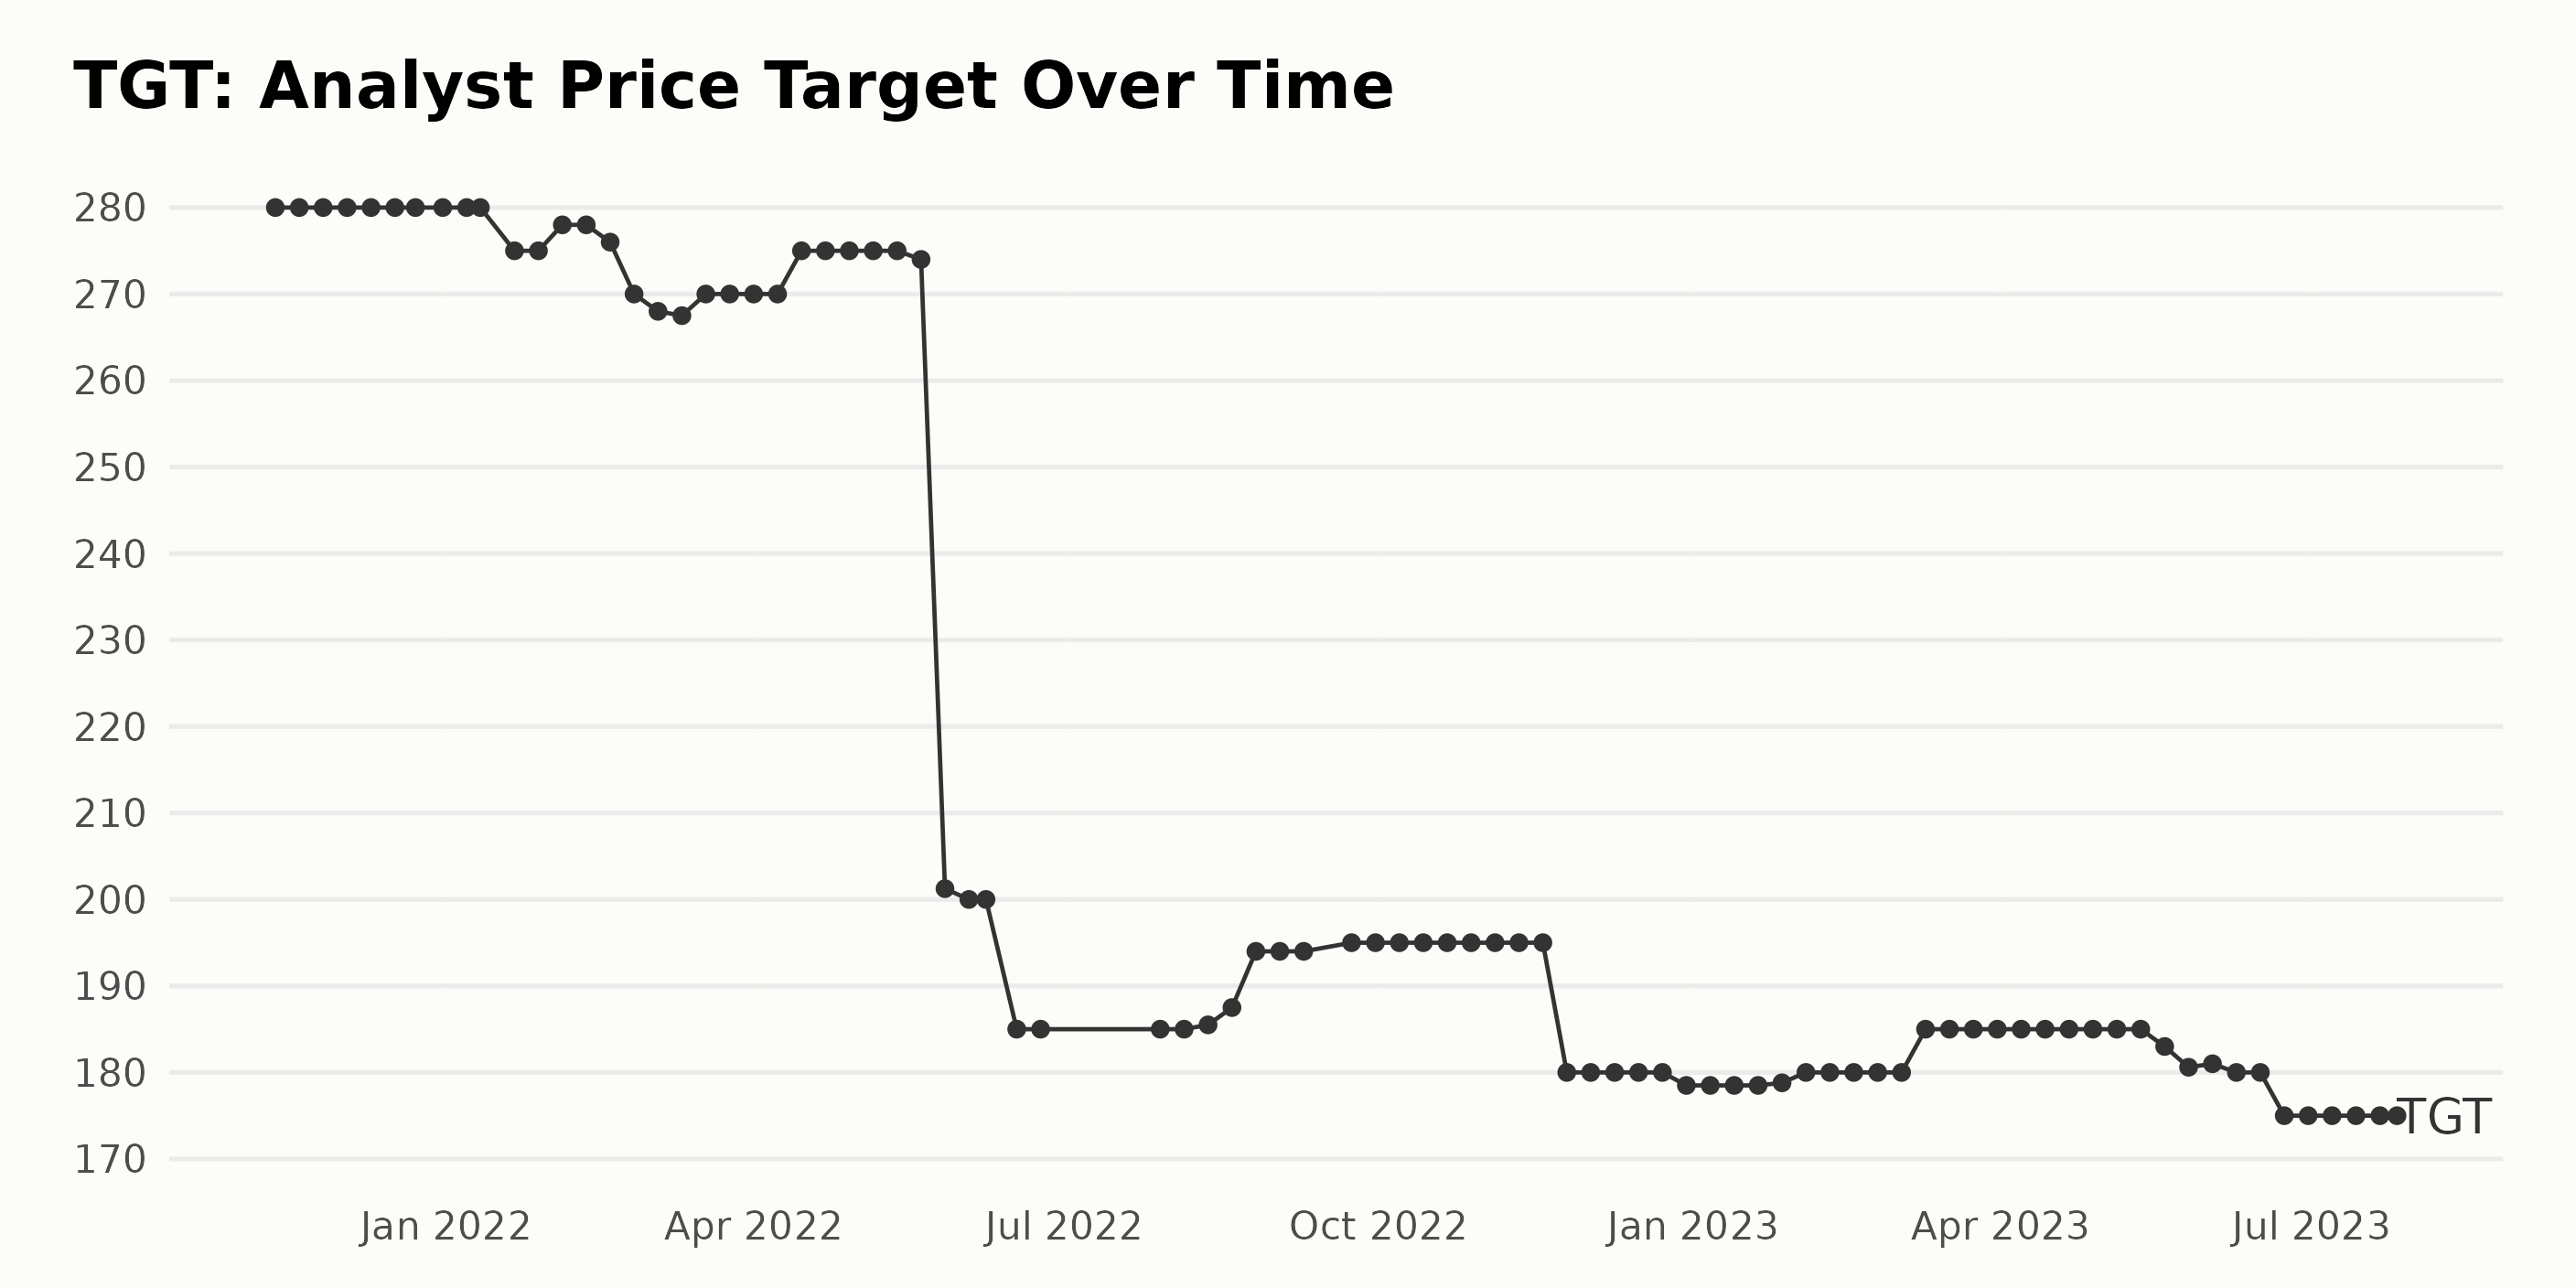
Based on the provided data series, the analyst price target for TGT fluctuated considerably over approximately two years, from November 2021 to July 2023.
- The data started at $280 in November 2021 and held steady at this value until January 2022.
- After fluctuating between $275 and $280 from January 2022 to May 2022, there was a sharp drop to $200 by June 2022. This accounts for a downward trend in the second half of 2022.
- From August 2022 to November 2022, the price target experienced slight growth, moving from $185.5 to $195.
- There was another significant decrease, with the price target dropping from $195 in November 2022 to $178.5 by December 2022.
- The first quarter of 2023 saw relative stability, with the price remaining between $178.5 and $180.
- In March 2023, there was a moderate increase to $185, maintained until mid-May 2023.
- The last set of figures shows a general decrease from $185 in mid-May 2023 to $175 in July 2023.
Looking at the overall trend, the price target has decreased by around 37.5% over this timeframe, suggesting a negative long-term projection made by the analysts. Considering the most recent data, the price target continues downward, rising slightly to $185, only to fall back to $175.
Target Corporation's Six-Month Stock Performance: A Study in Steady Deceleration
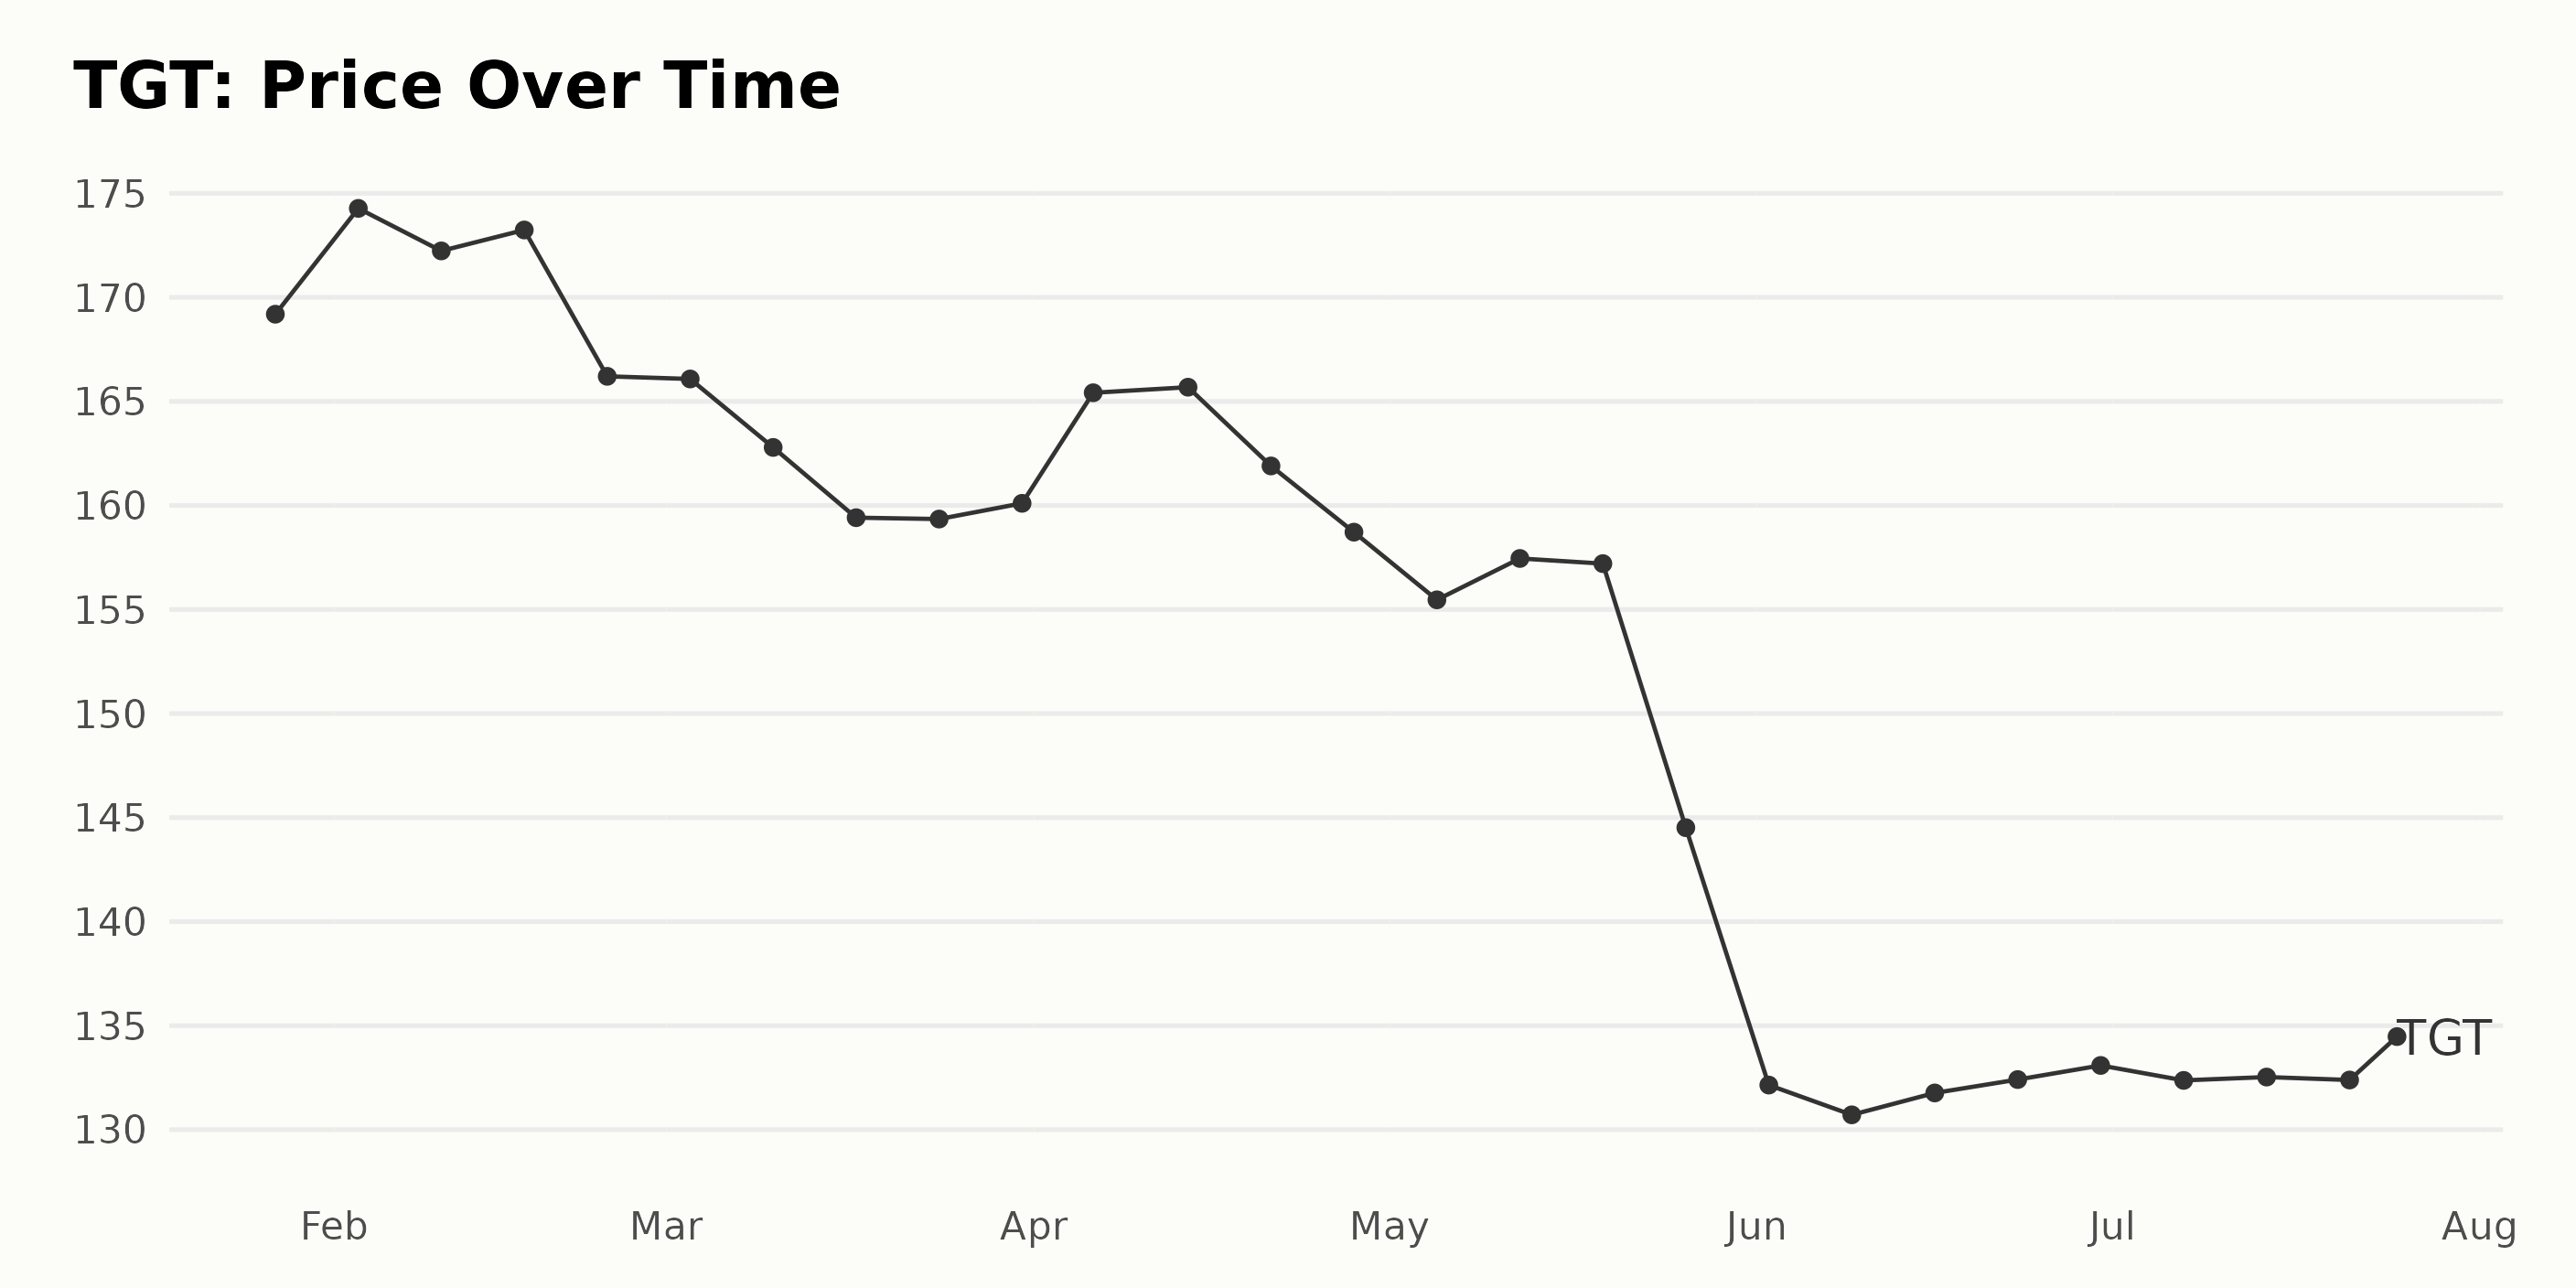
The data shows the share price of TGT over an approximately six-month period, from late January to late July 2023. Generally, an overall declining trend is observed in the share prices over this term.
- The price begins at $169.19 on January 27, 2023. Incremental growth is noticed in the first three weeks, peaking at $174.28 by February 3, 2023.
- However, the prices then start to show a slight wavering trend until February 24, with a modest dip to $166.21.
- In March 2023, the prices declined progressively from $166.08 in the first week to $159.35 toward the end of the month.
- In April 2023, there's a short uptick as the prices increase to $165.68 in the middle of the month. However, the prices then decline again to $158.72 by the month’s end.
- Throughout May and early June 2023, the prices continue their downward trend, with a steep drop observable from late May. The price on May 26 is $144.51 and drops further to a low point of $130.71 by June 9.
- From there, from mid-June through July, the prices start to stabilize and exhibit a slow upward trend, ending at $133.60 on July 25, 2023.
In terms of rate, while the initial few weeks saw a subtle rise in prices, most of the period from late February onwards was characterized by a consistent decrease in TGT’s share prices.
There was a particularly sharp drop during late May, followed by a stabilization period in June and July with a slight upward trend. The overall trend can therefore be characterized as a steady deceleration in share price growth. Here is a chart of TGT’s price over the past 180 days.
Analyzing Target Corporation's Value, Momentum, and Growth: POWR Ratings Insight
TGT, a stock in the Grocery/Big Box Retailers category, which totals 38 stocks, has experienced changes in its POWR Ratings grade and rank in the category during 2023.
- The stock had a steady POWR Grade of C (Neutral) from January 28, 2023, to May 27, 2023. During this period, its rank in the category slightly improved, moving from #36 to #31.
- From June 3, 2023, to July 8, 2023, TGT’s POWR Grade improved to B (Buy). Concurrently, its rank in the category improved even further, peaking at #25 on June 3, 2023, but slipping slightly back to #27 by July 8, 2023.
- In the subsequent weeks of July, TGT’s POWR Grade fell back to C (Neutral) as of July 22, 2023. Its rank in the category during this period was steady at #26.
The latest data from July 26, 2023, indicates that TGT maintained a POWR Grade of C (Neutral) and a rank in the category of #26.
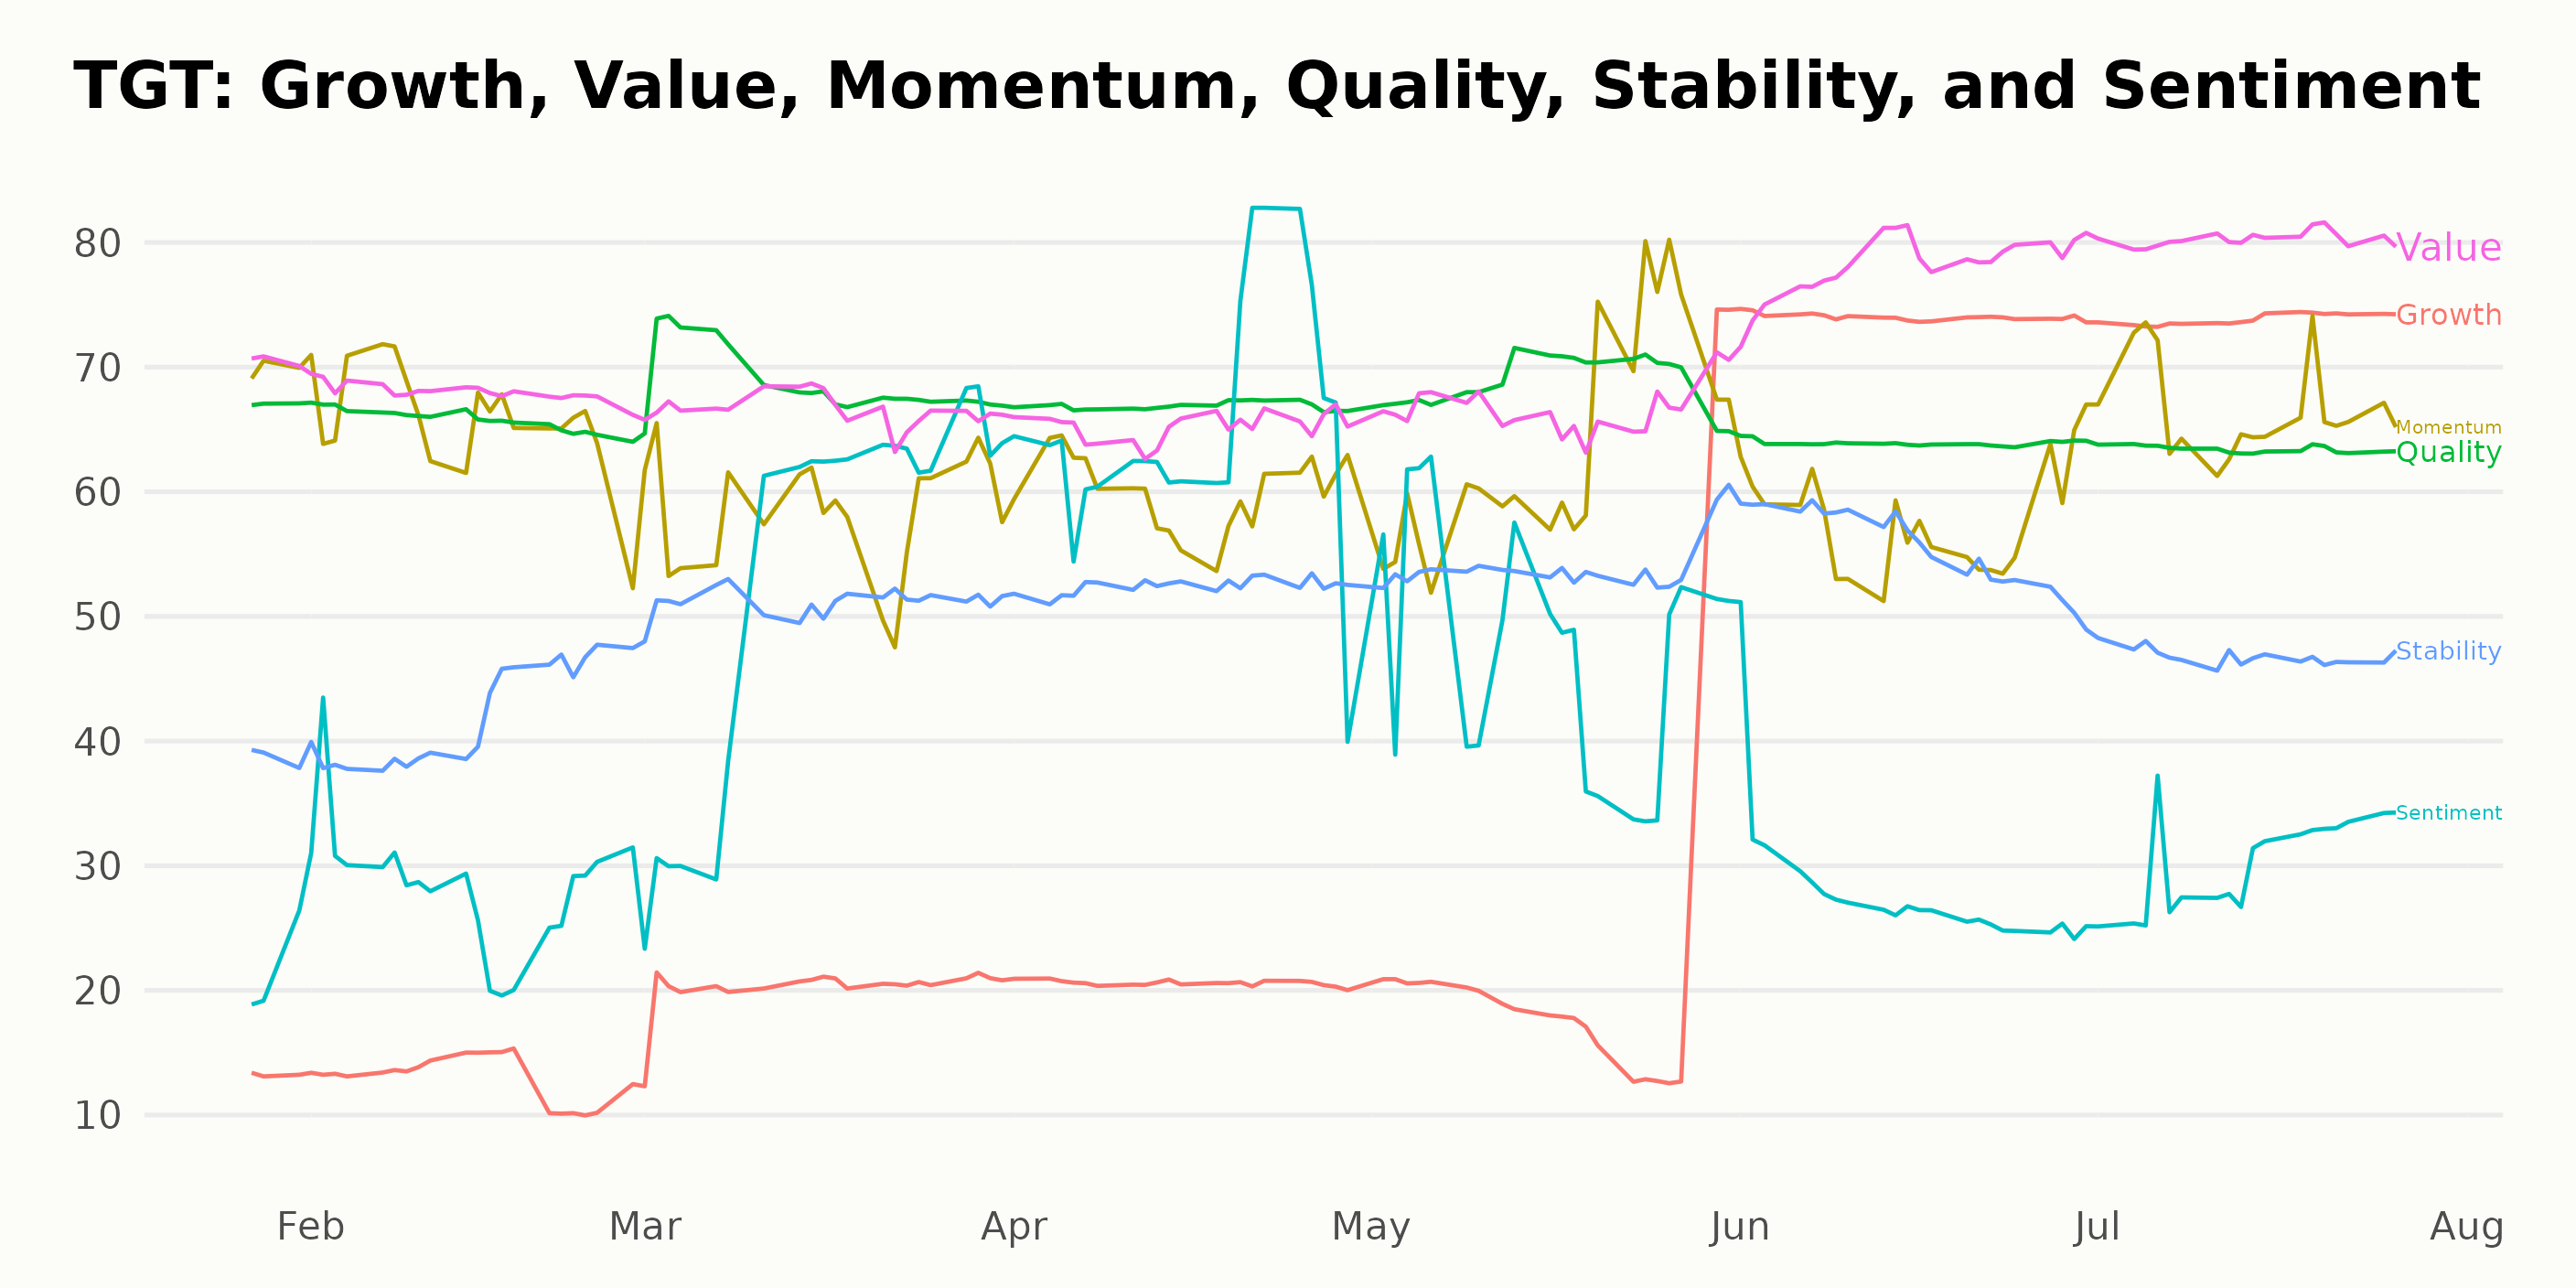
From the POWR Ratings data provided, the three most noteworthy dimensions for TGT are Value, Momentum, and Growth. Let's discuss their ratings and trends.
Value: TGT’s Value dimension has generally high ratings over the given period. As of January 2023, the Value rating was at a strong 71. Its rating in the following months showed a small decline from February to April 2023 (from 68 to 65). Importantly, a clear increase began to emerge in May with a rating of 67, reaching the highest level for the period at 80 by July 2023.
Momentum: Momentum began at a notably high level of 70 in January 2023 and then moved downward in an apparent trend. The rating hit a low of 58 by both March and June 2023. A slight improvement was observed by July 2023, bringing the Momentum rating up to 67.
Growth: The Growth dimension showed a significant upward trend throughout the period. - It started quite low at 13 in January 2023. Over time, it saw a steady rise, eventually taking a giant leap from 23 in May 2023 to 74 in June 2023. This growth maintained at the same level of 74 even by July 2023.
Thus, according to the POWR Ratings, TGT demonstrated the most notable performances and changes in its Value, Momentum, and Growth ratings over this period.
How does Target Corporation (TGT) Stack Up Against its Peers?
Other stocks in the Grocery/Big Box Retailers sector that may be worth considering are Village Super Market, Inc. (VLGEA), Koninklijke Ahold Delhaize N.V. (ADRNY), and Natural Grocers by Vitamin Cottage, Inc. (NGVC) - they have better POWR Ratings.
What To Do Next?
Discover 10 widely held stocks that our proprietary model shows have tremendous downside potential. Please make sure none of these “death trap” stocks are lurking in your portfolio:
TGT shares were trading at $134.59 per share on Wednesday afternoon, up $0.99 (+0.74%). Year-to-date, TGT has declined -8.51%, versus a 19.67% rise in the benchmark S&P 500 index during the same period.
About the Author: Anushka Dutta

Anushka is an analyst whose interest in understanding the impact of broader economic changes on financial markets motivated her to pursue a career in investment research.
The post Should Investors Start Targeting Shares of Target (TGT)? appeared first on StockNews.com