
Constellation Energy Corporation (CEG), a leading producer of carbon-free energy, has committed itself to eliminating 100% of its greenhouse gas emissions by 2040. The company plans to achieve this ambitious objective by incorporating cutting-edge technologies and strategically utilizing its diverse portfolio.
CEG delivered a solid performance in its earnings per share (EPS), exceeding consensus estimates by 19.2%. However, it fell short of meeting revenue forecasts, with revenues undershooting analysts' expectations by 14.2%, equivalent to $1.01 billion. The third quarter of 2023 was particularly noteworthy as the company reversed its fortunes, transforming a Net Loss of $188 million from the third quarter of 2022 to post a net income of $731 million, signaling a substantial financial recovery.
Despite steady growth over the quarter, the company's results were impacted by unfavorable labor, contracting, and materials and decreased ZEC revenue.
Despite the earnings beat, it may not necessarily reflect the optimal entry point for potential shareholders into the stock. Thus, a closer examination of its key financial metrics is recommended to better understand the company's current position.
CEG's Financial Performance: Examining Net Income, Revenue and Key Metrics, 2020-2023
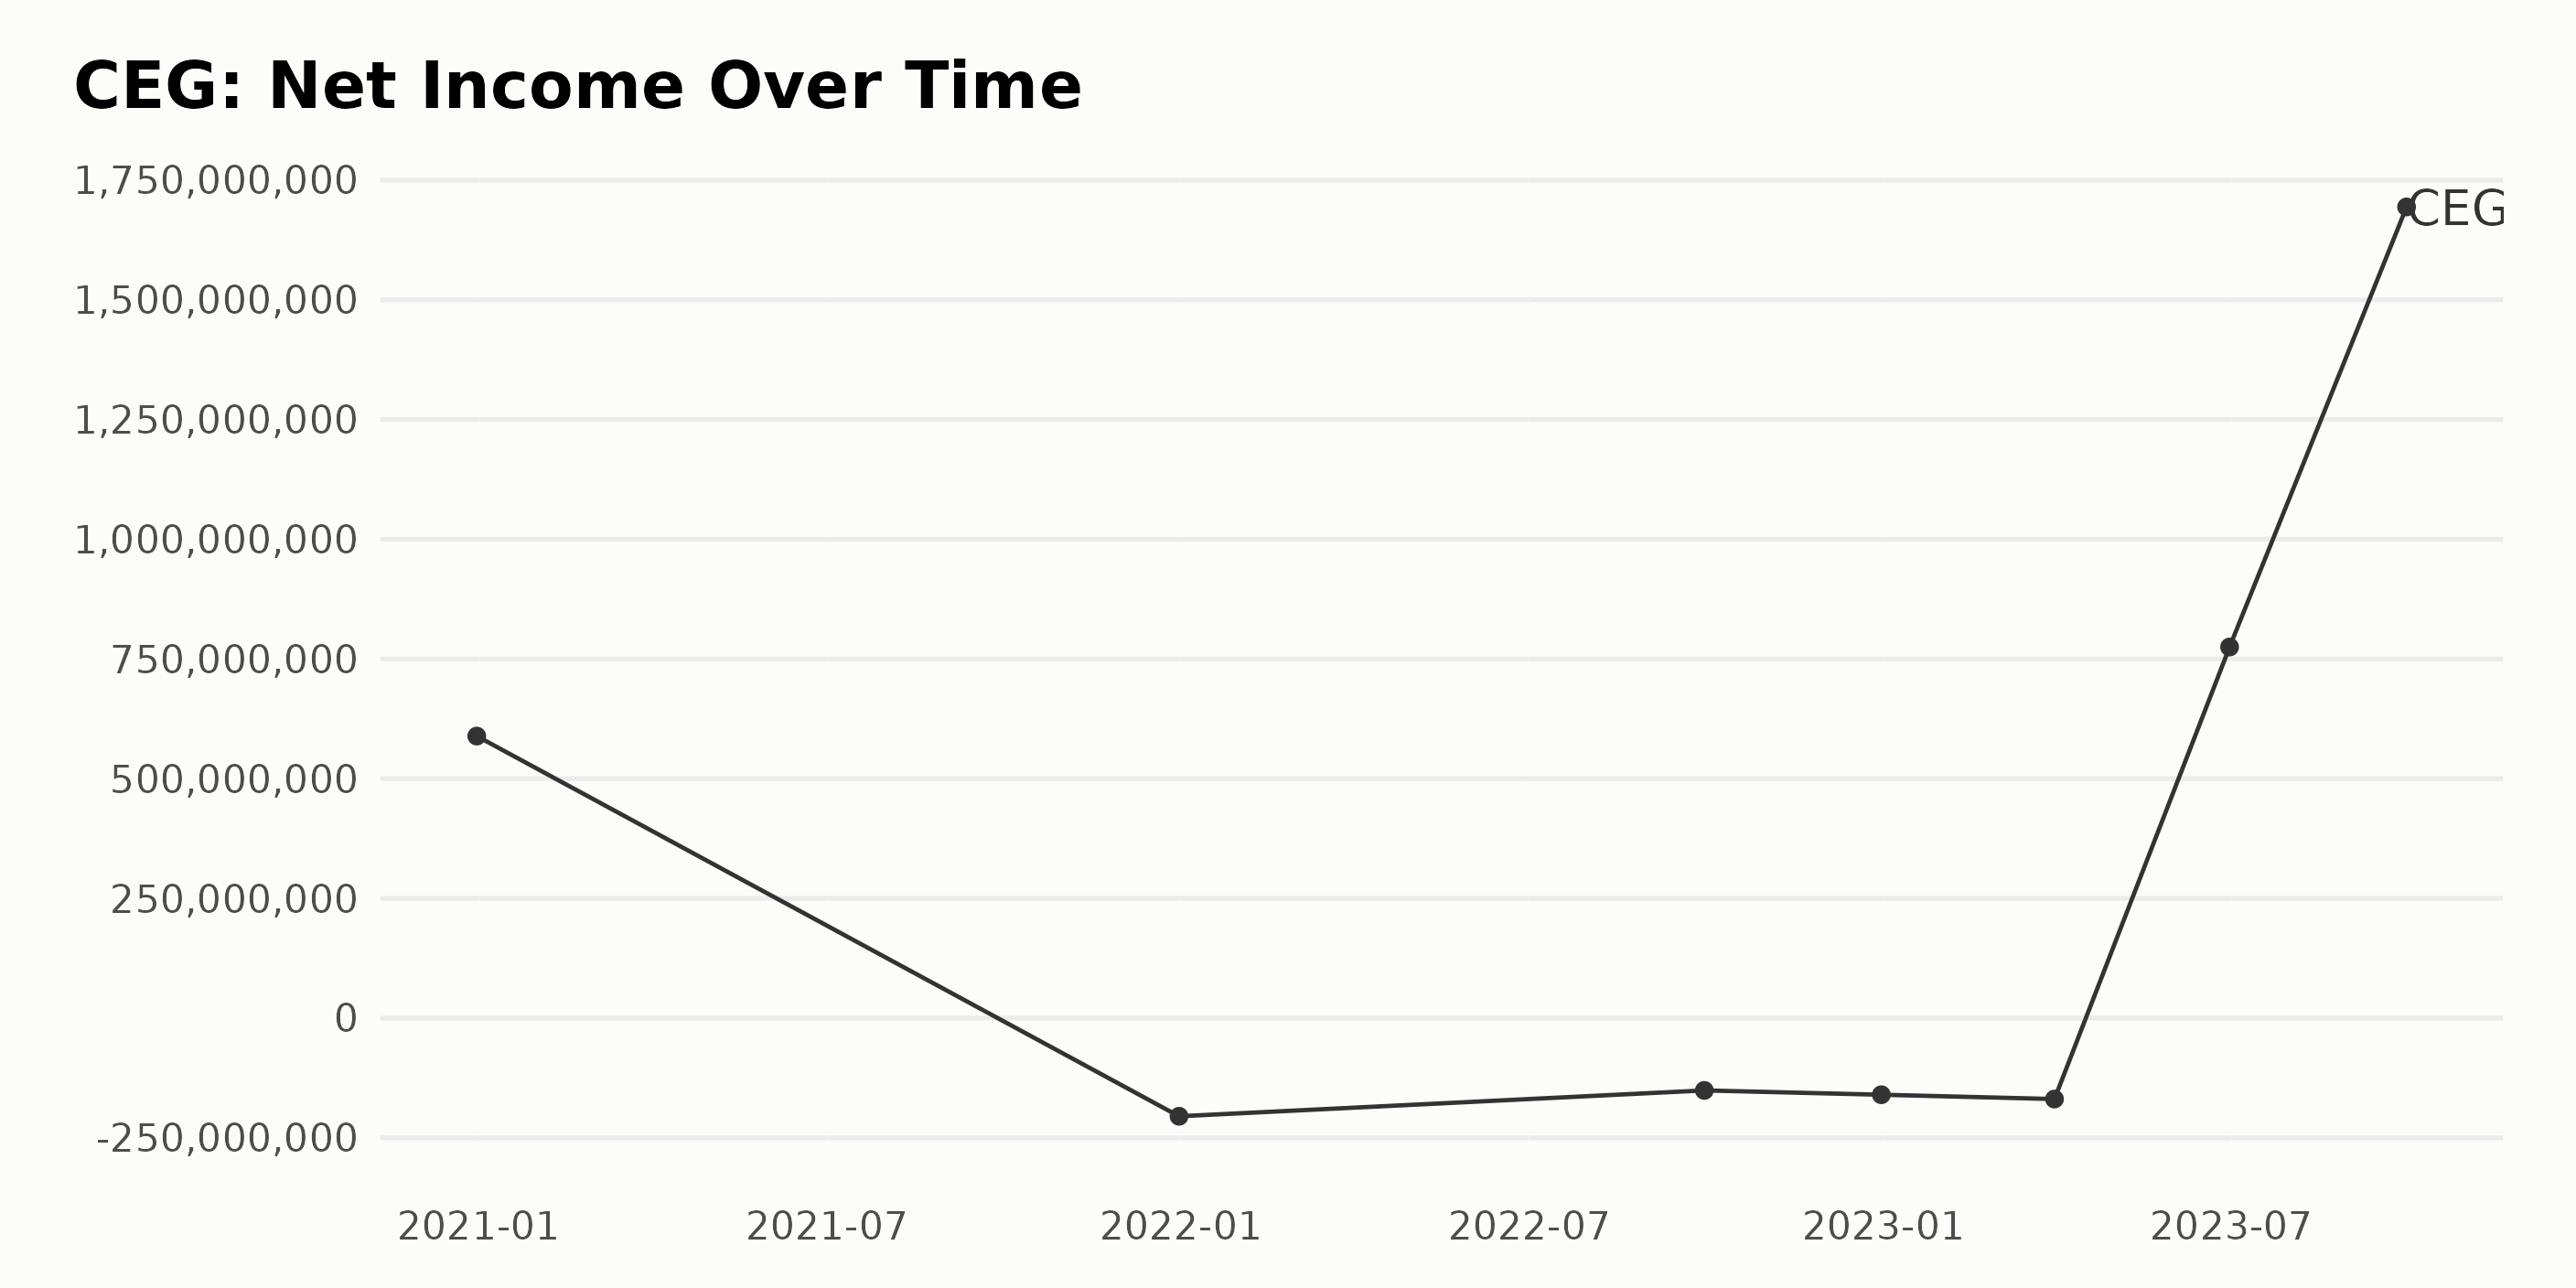
The trailing-12-month net income of CEG consistently fluctuated over time with major shifts identified. To start with,
- On December 31, 2020, the Net Income of CEG stood at $589 million.
- By December 31, 2021, there was a sharp decrease to -$205 million, implying a loss for the company.
- This downward trend continued into 2022, with a net income of -$151 million as of September 30 and further dipped to -$160 million by the end of the year.
- In the first quarter of 2023, the losses deepened to -$169 million.
However, the firm made a significant turnaround in the following quarters of 2023:
- Net Income bounced back substantially to $775 million by June 30.
- Remarkably, the third quarter of 2023 saw the most dramatic improvement, reaching a Net Income peak at $1.69 billion.
Overall, while there has been substantial volatility in CEG's net income performance, the most recent data points suggest a rebound.
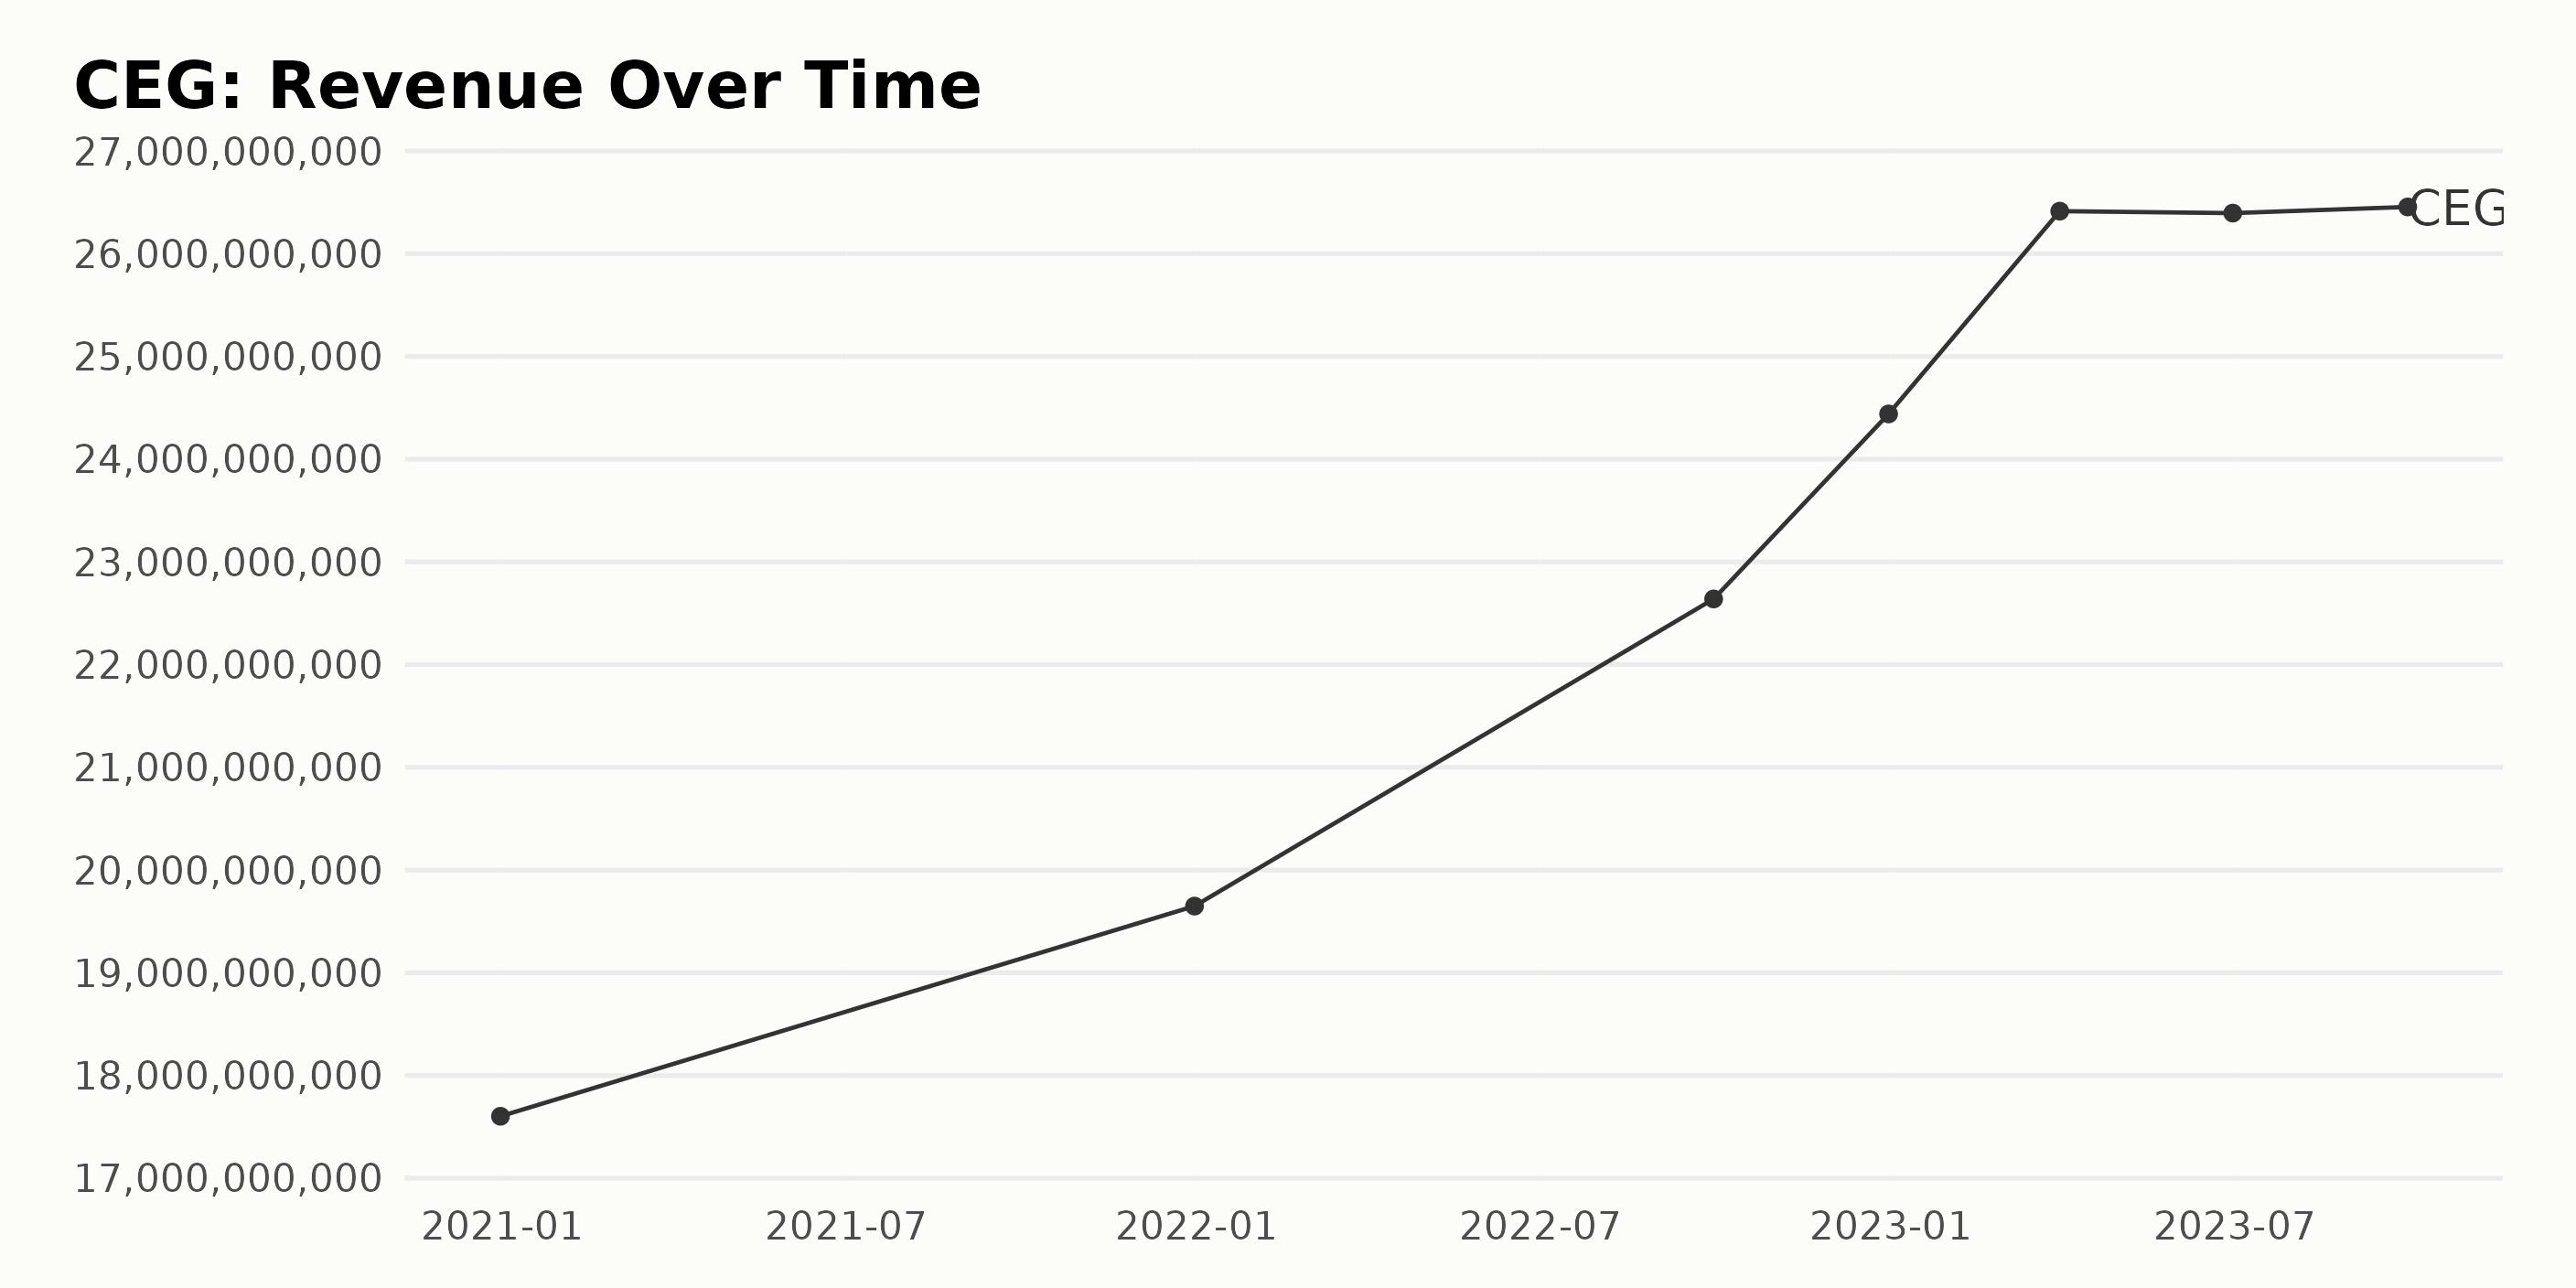
The trailing-12-month revenue of CEG has been experiencing a steady and substantial upward trend over the defined series. Beginning at $17.6 billion on December 31, 2020, the Revenue exhibited periodic fluctuations, with some notable increases and decreases observed.
- On December 31, 2021, there was a significant jump to $19.65 billion.
- Few months later, on September 30, 2022, the Revenue escalated to $22.64 billion.
- By the end of 2022, it experienced another considerable elevation, reaching $24.44 billion on December 31, 2022.
- It peaked at $26.41 billion on March 31, 2023,
- However, a minor reduction was observed by June 30, 2023, with the Revenue slightly decreasing to $26.4 billion.
- This was followed by a marginal increase, placing the Revenue at $26.46 billion as of September 30, 2023.
Given the initial value of $17.6 billion and the last reported value of $26.46 billion, CEG enjoyed an impressive Revenue growth rate. Despite minor fluctuations, the overall trend throughout this time frame reflects a positive expansion in CEG's Revenue.
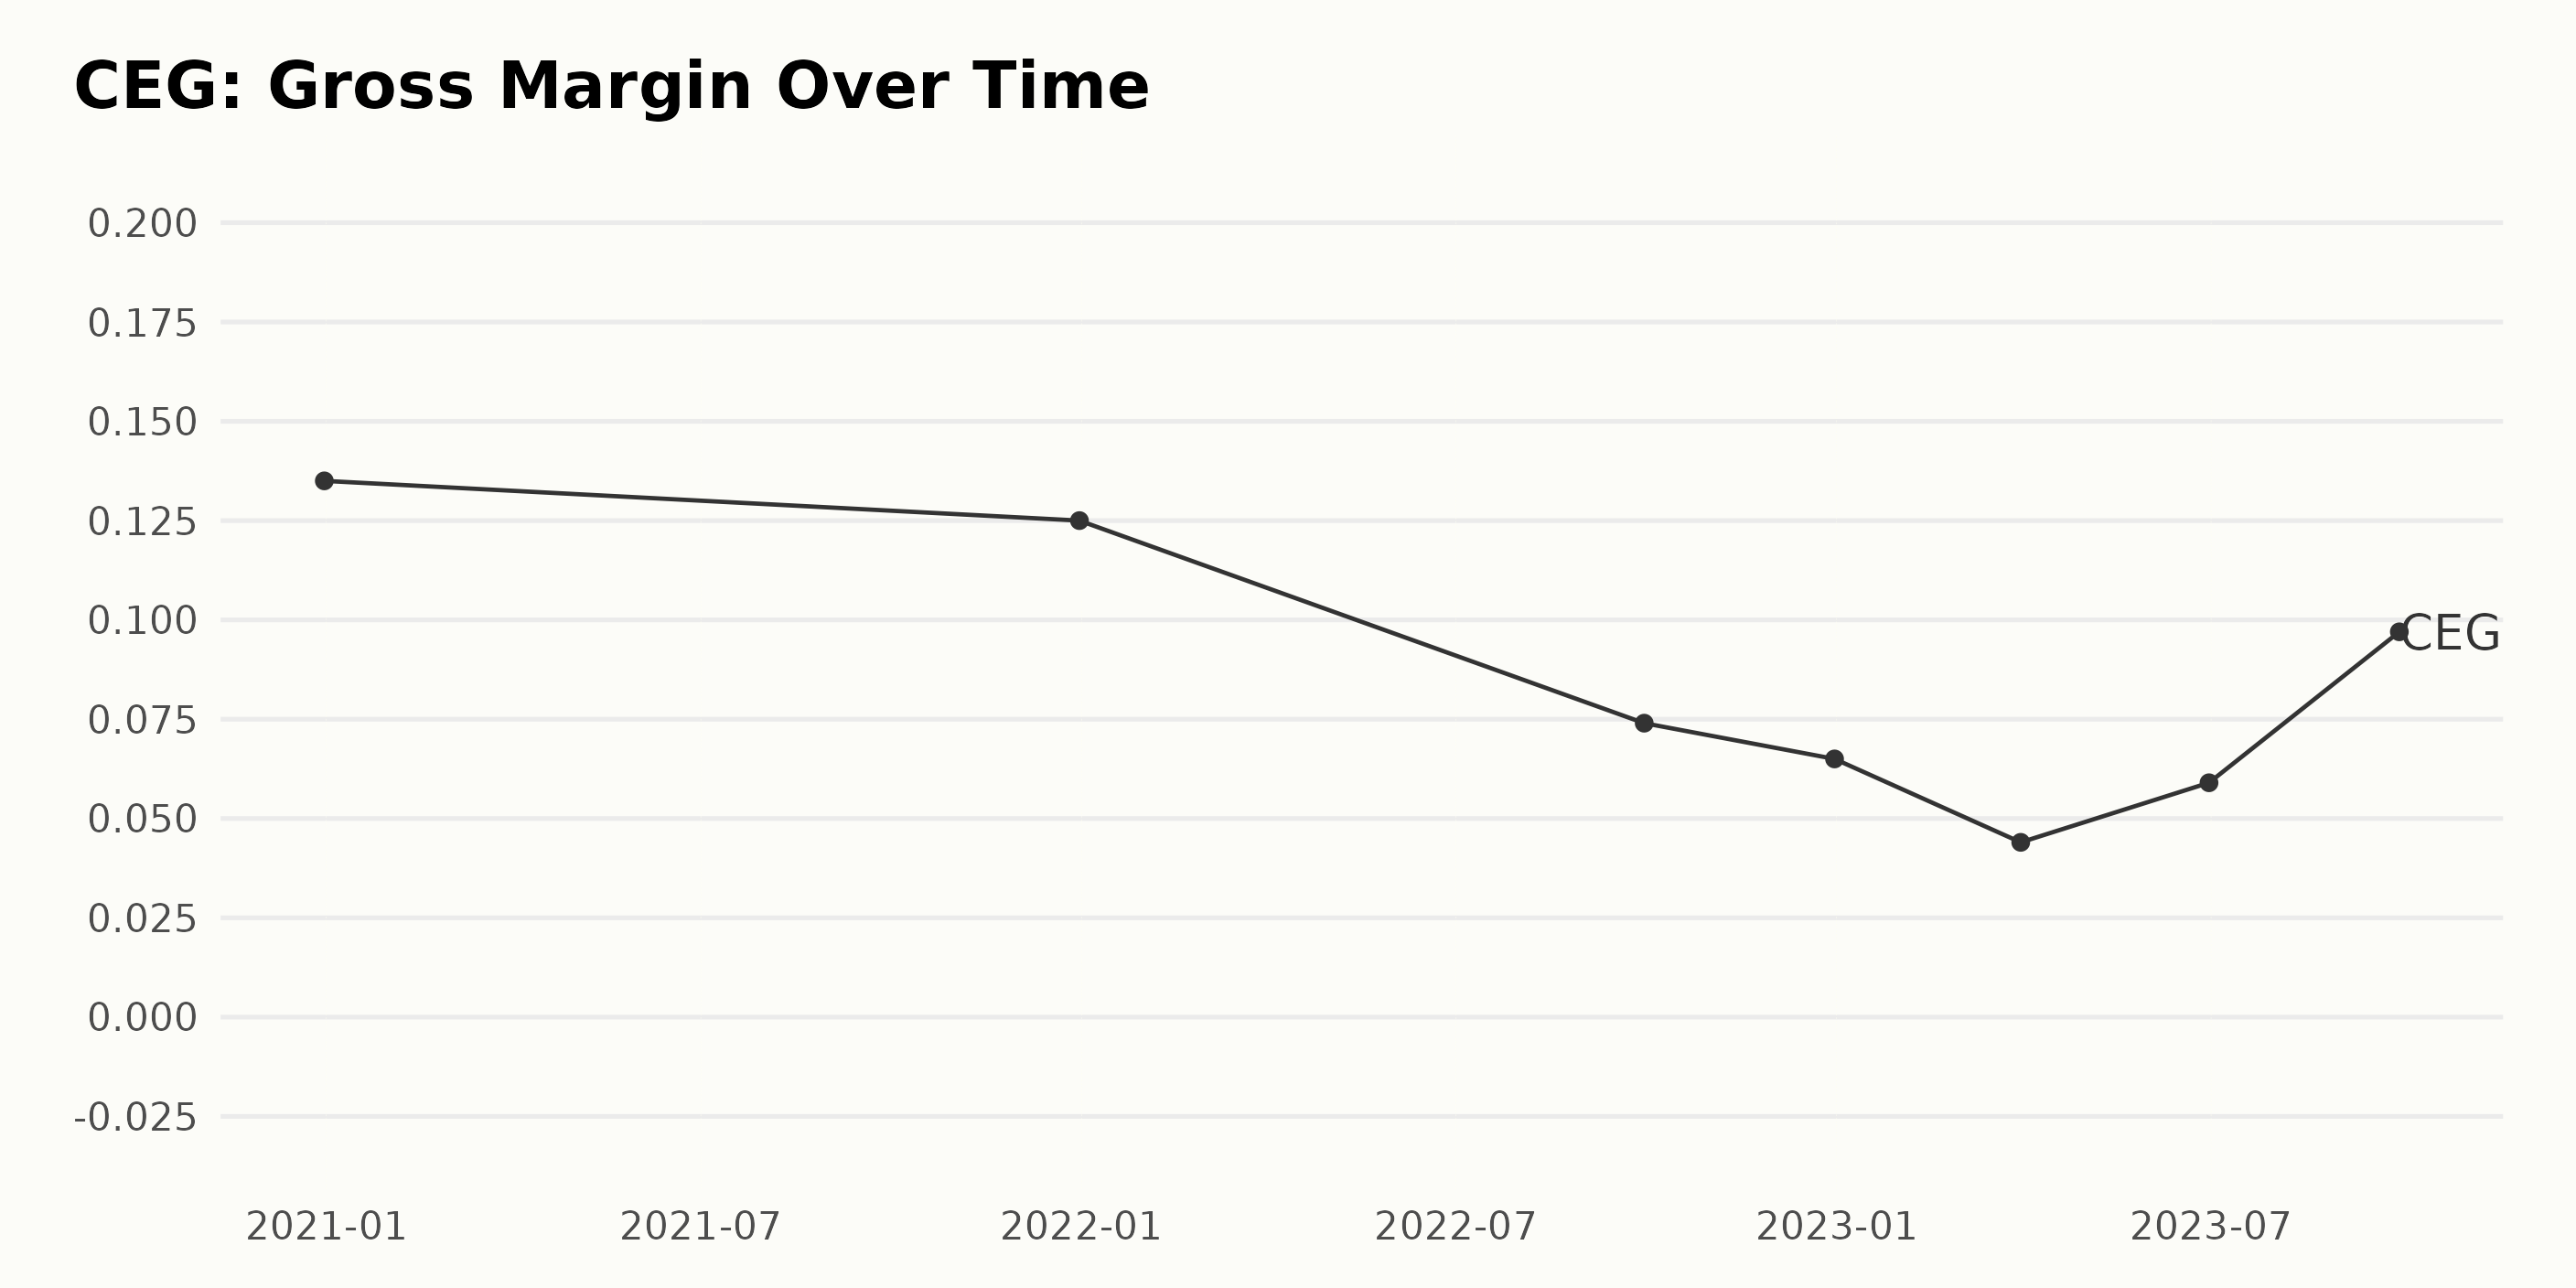
The Gross Margin for CEG has exhibited notable fluctuations over the given period, from the end of 2020 to the end of the third quarter in 2023.
- As of December 31, 2020, the Gross Margin of CEG was at 13.5%.
- The Gross Margin dropped slightly to 12.5% by the end of December 2021.
- A more significant decrease was noted on September 30, 2022, as the Gross Margin fell to 7.4%.
- There was a further small decrease in the Gross Margin to 6.5% by December 31, 2022.
- In the first quarter of 2023, the Gross margin dipped to its lowest point at 4.4%, on March 31.
- After the first quarter of 2023, the Gross Margin started to recover, and by June 30, 2023, it rebounded to 5.9%.
- As of the end of the third quarter in 2023, September 30, there has been a strong recovery to a Gross Margin of 9.7%.
Over the entire range of recorded data, the Gross Margin decreased by 35.56%. The more recent upward trend in 2023 indicates that the Gross Margin is rebounding after reaching a low point.
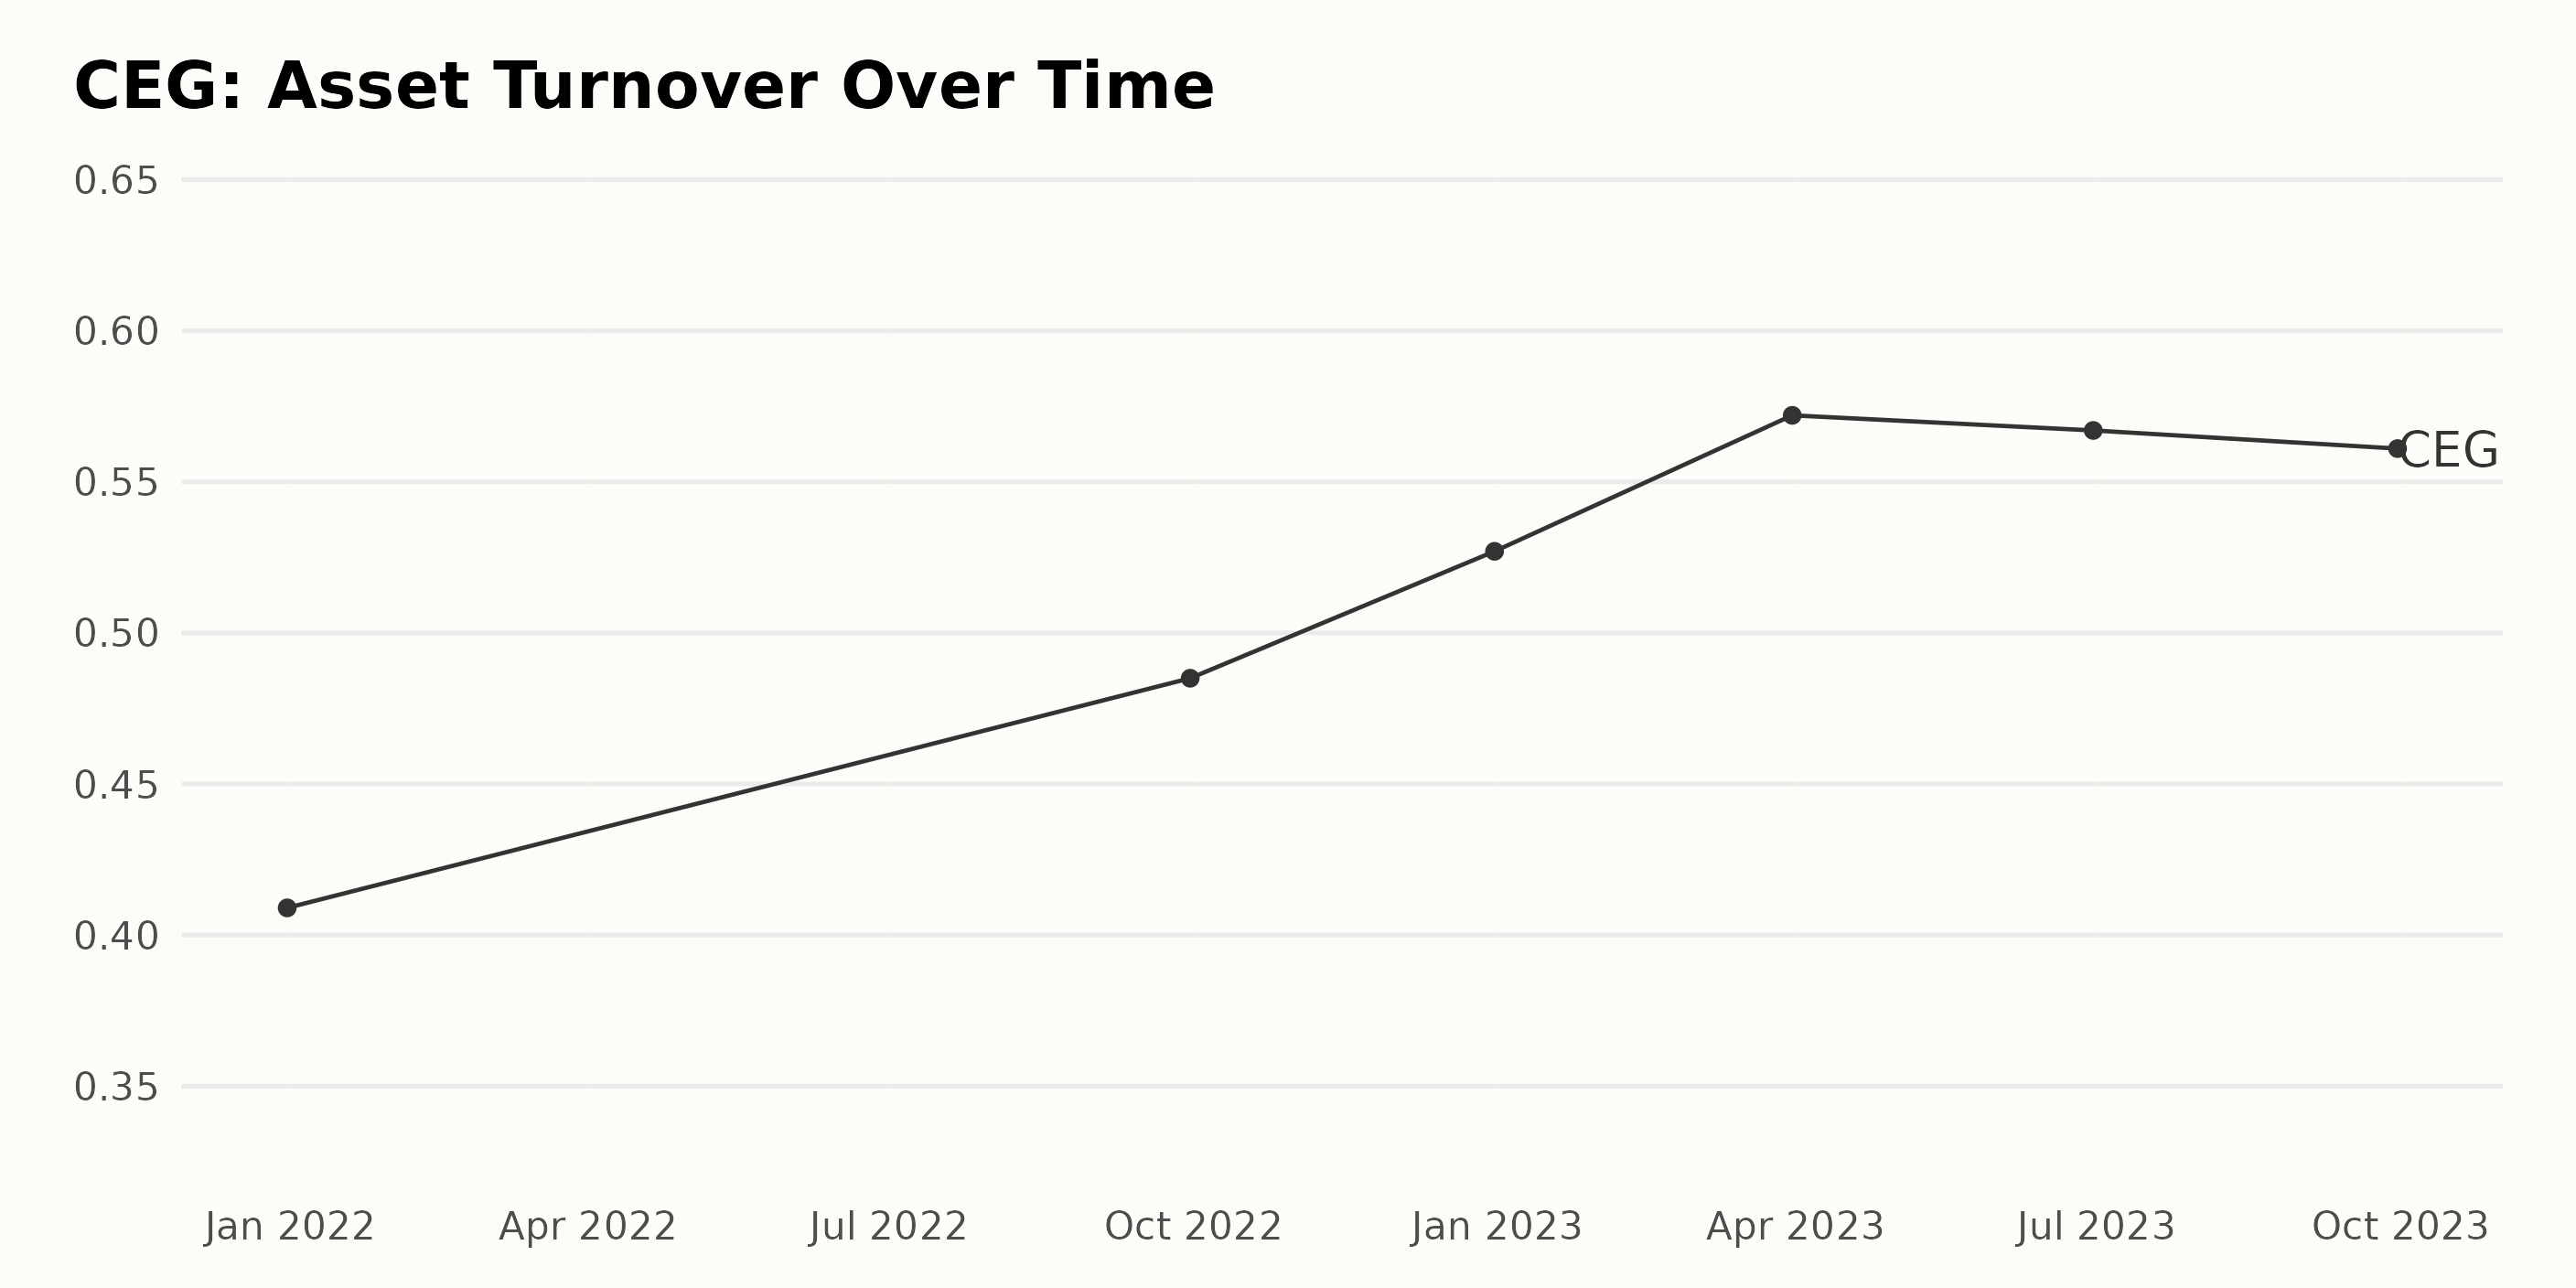
The Asset Turnover figures for the company CEG depict a general upward trend. Here is a summary of the data:
- December 31, 2021 - The Asset Turnover was 0.41.
- September 30, 2022 - The Asset Turnover rose to 0.49, an increase from the figure recorded in the previous year.
- December 31, 2022 - There was a further increase in Asset Turnover, reaching 0.53 by the end of the year.
In the first half of 2023, the Asset Turnover peaked before showing slight fluctuations:
- March 31, 2023 - The first quarter of 2023 experienced a peak in Asset Turnover at 0.57. This was the highest value recorded in the series data provided.
- June 30, 2023 - The Asset Turnover slightly dropped down to 0.57 by the end of the second quarter.
- September 30, 2023 - There was another minor decrease in the third quarter, with the Asset Turnover dipping to 0.56.
Overall, this growth signifies a positive improvement in using the assets to generate revenue. Yet, the minor recent dips in metric could warrant further investigation.
CEG Shares Exhibit Prominent Growth: A Statistical Overview of May-November 2023
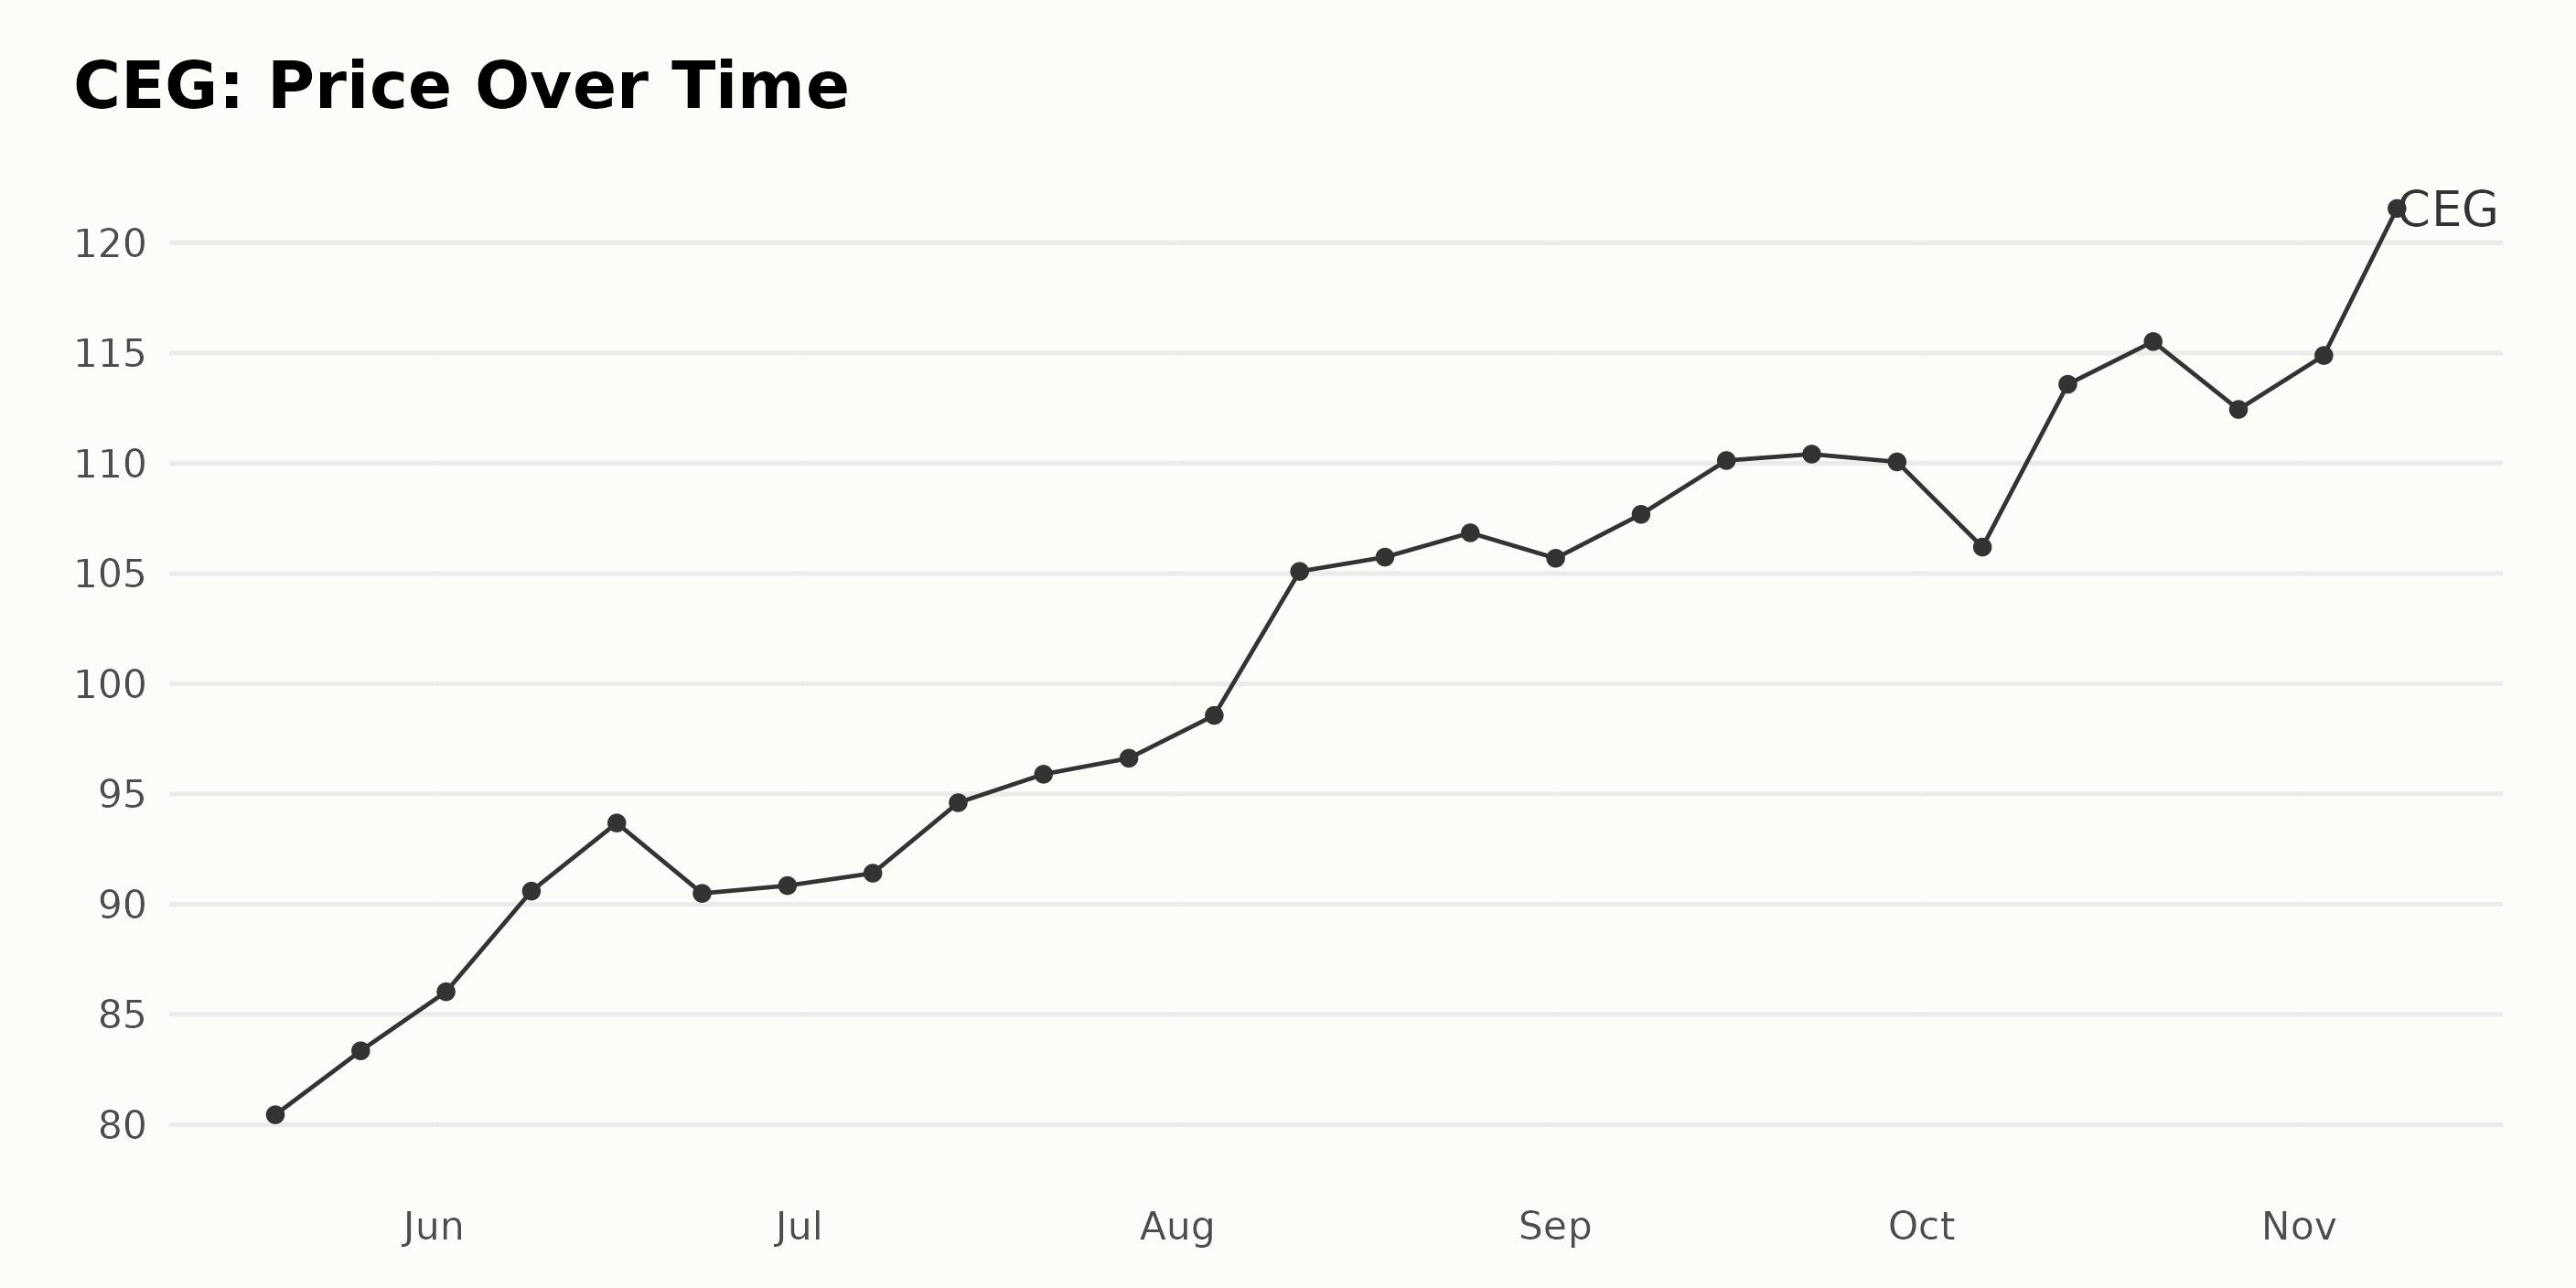
Analyzing the provided data for CEG, there seems to be a noticeable upward trend in the share prices from May 2023 to November 2023. The growth has its peaks and lows, but the general trajectory is inclining. Key Points: -
- On May 19, 2023, the share price was at $80.45.
- There was a surge of share price hitting its peak at $93.68 on June 16, 2023, which then dipped to $90.49 a week later on June 23, 2023.
- However, the shares experienced a gradual increase throughout July reaching up to $96.62 by the end of the month.
- August 2023 was a turning point. There was a substantial increase with the share price going above $100. By August 25, 2023, the share price had risen to $106.84.
- Despite a brief decline to $105.69 at the start of September, the share price rose again over the month, reaching $110.41 by September 22, 2023.
- Following a small drop in early October, the price escalated sharply to reach a new peak of $115.52 on October 20, 2023.
- The highest share price in the available data is recorded on November 9, 2023, at $121.56.
In terms of the growth rate, the share prices of CEG increased by approximately 50% (from $80.45 to $121.56) over the period of six months (May 2023-November 2023). With few regressions, the overall growth is prominent and positive. Here is a chart of CEG's price over the past 180 days.
Analyzing CEG's Performance: Growth, Momentum, and Sentiment Trends in 2023
CEG has an overall C rating, translating to a Neutral in our POWR Ratings system. It is ranked #12 out of the 65 stocks in the Utilities - Domestic category.
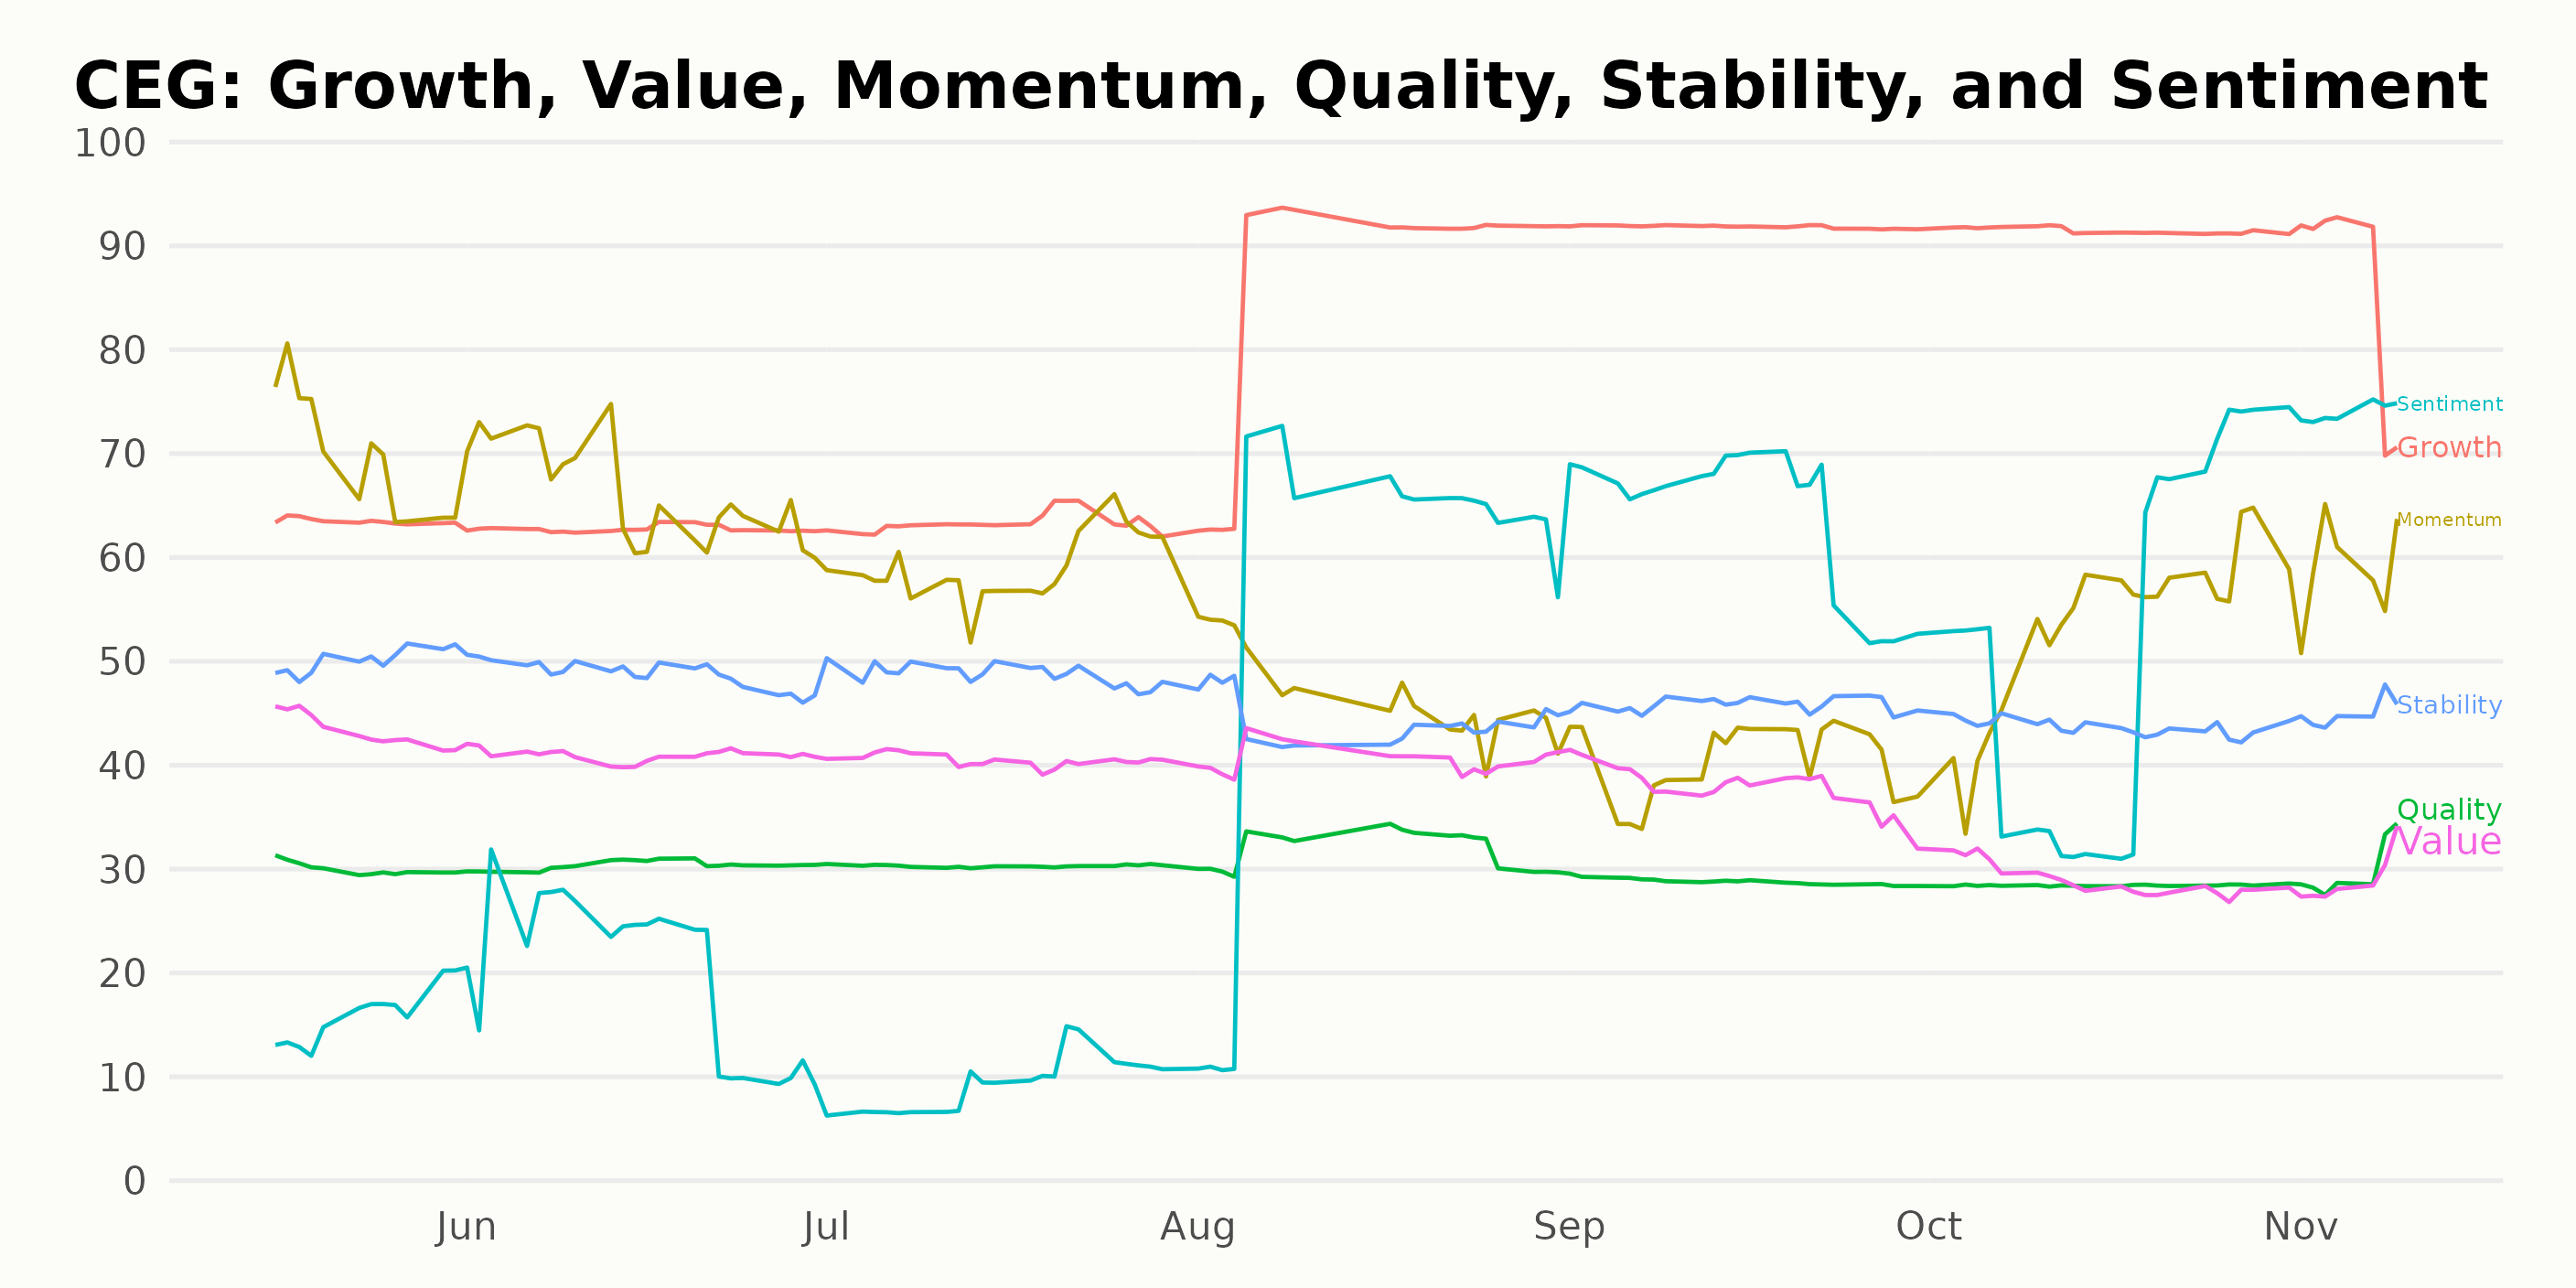
Within the POWR Ratings of CEG, three distinct dimensions stand out - Growth, Momentum, and Sentiment. Here's a detailed look at their performance over time:
Growth
- In May 2023, the Growth rating was at 64.
- It saw a minor drop to 63 in June 2023, and remained the same till July 2023.
- There was a significant increase in August 2023 when the rating jump up to an impressive 86. The growth continued and reached its highest at a rating of 92 in September 2023.
- By October 2023, the rating slightly decreased to 91, and by November 9, 2023, it fell to 86. Despite this fall towards the end of 2023, the Growth rating stayed high relative to the beginning of this time period.
Momentum
- The Momentum rating started at 70 in May 2023, however, over the next few months there was a clear downward trend. The rating dropped to 66 in June 2023, and further to 59 in July 2023.
- In August 2023, the rating saw a significant drop to 47. It further decrease to 40 in September 2023, indicating a persistent downtrend.
- Contrary to the previous months, Momentum bounced back to 53 in October 2023 and climbed further to 59 by November 9, 2023, showing slight recovery.
Sentiment
- The Sentiment rating for CEG in May 2023 was only 16. However, it showed a significant upward trend over the following months.
- After a minor increase to 20 in June 2023, the Sentiment rating soared in subsequent months - reaching 53 in August 2023.
- Thereafter, it continued on an upward trajectory reaching 64 in September 2023 and even 74 by November 9, 2023. This represents a clear positive trend overall.
These ratings provide valuable insights into the performance of CEG along these three dimensions. The Growth dimension shows high performance with a slight decrease towards the end of the year. Momentum shows a downward trend with slight recovery towards the end. The Sentiment dimensions showed a clear and consistent positive trend.
How does Constellation Energy Corporation (CEG) Stack Up Against its Peers?
Other stocks in the Utilities - Domestic sector that may be worth considering are Genie Energy Ltd. (GNE), Vistra Energy Corp. (VST), and Atlantic Power Corporation (AT) -- they have better POWR Ratings.
What To Do Next?
43 year investment veteran, Steve Reitmeister, has just released his 2024 market outlook along with trading plan and top 11 picks for the year ahead.
CEG shares were trading at $122.35 per share on Friday afternoon, up $1.72 (+1.43%). Year-to-date, CEG has gained 43.32%, versus a 15.57% rise in the benchmark S&P 500 index during the same period.
About the Author: Subhasree Kar

Subhasree’s keen interest in financial instruments led her to pursue a career as an investment analyst. After earning a Master’s degree in Economics, she gained knowledge of equity research and portfolio management at Finlatics.
The post Constellation Energy (CEG) Earnings Beat -- Buy or Sell? appeared first on StockNews.com