
New Jersey Resources Corporation (NJR) reported results for the fiscal fourth quarter and year ended fiscal 2023 this week. The company reported a decrease in net income for the fiscal year, totalling $264.72 million, or $2.71 per share, compared to $274.92 million, or $2.85 per share, in fiscal 2022.
Fourth-quarter fiscal 2023 net income totaled $37.02 million, or $0.38 per share, compared with net income of $54.52 million, or $0.56 per share, during the same period in fiscal 2022.
NJR did manage to increase its net financial earnings (NFE) throughout fiscal 2023, reaching a total of $261.80 million or $2.70 per share, up from $240.30 million or $2.50 per share the previous year.
Street expects NJR’s EPS for the fiscal quarter ending December 2023 to come in at $0.90, indicating a 20.8% decline year-over-year.
The stock has been beaten down lately with too much selling pressure, which might remain in the near term. NJR shares have declined 14% year-to-date. Considering gloomy market sentiments, I believe NJR is best avoided now. A more detailed analysis of the firm's key financial metrics will provide further insight into its current standing.
Analyzing Financial Performance & Trends of New Jersey Resources Corporation
The trailing-12-month Net Income of the NJR underwent various fluctuations from December 2020 to September 2023. The details are as follows:
- December 2020: NJR reported a Net Income of $185.6 million.
- March 2021: A significant increase occurred with the Net Income reaching $246.9 million.
- June 2021: There was a considerable dip in the Net Income as it decreased to $162.3 million.
- September 2021: The decrease continued, with the Net Income reaching $117.9 million.
- December 2021: The company then experienced a rebound as its net income reached $148.16 million.
- March 2022: A relative decline was seen as the Net Income dropped to $94.38 million.
- June 2022: A substantial increase ensued, with the Net Income reaching $219.27 million.
- September 2022: The positive trend continued, and the Net Income climbed to $274.92 million.
- December 2022: Net Income further increased to reach $279.53 million.
- March 2023: A notable rise was seen, with the Net Income jumping to $293.74 million.
- June 2023: The Net Income then slightly dropped to $282.22 million.
- September 2023: Finally, it further decreased to reach $264.72 million.

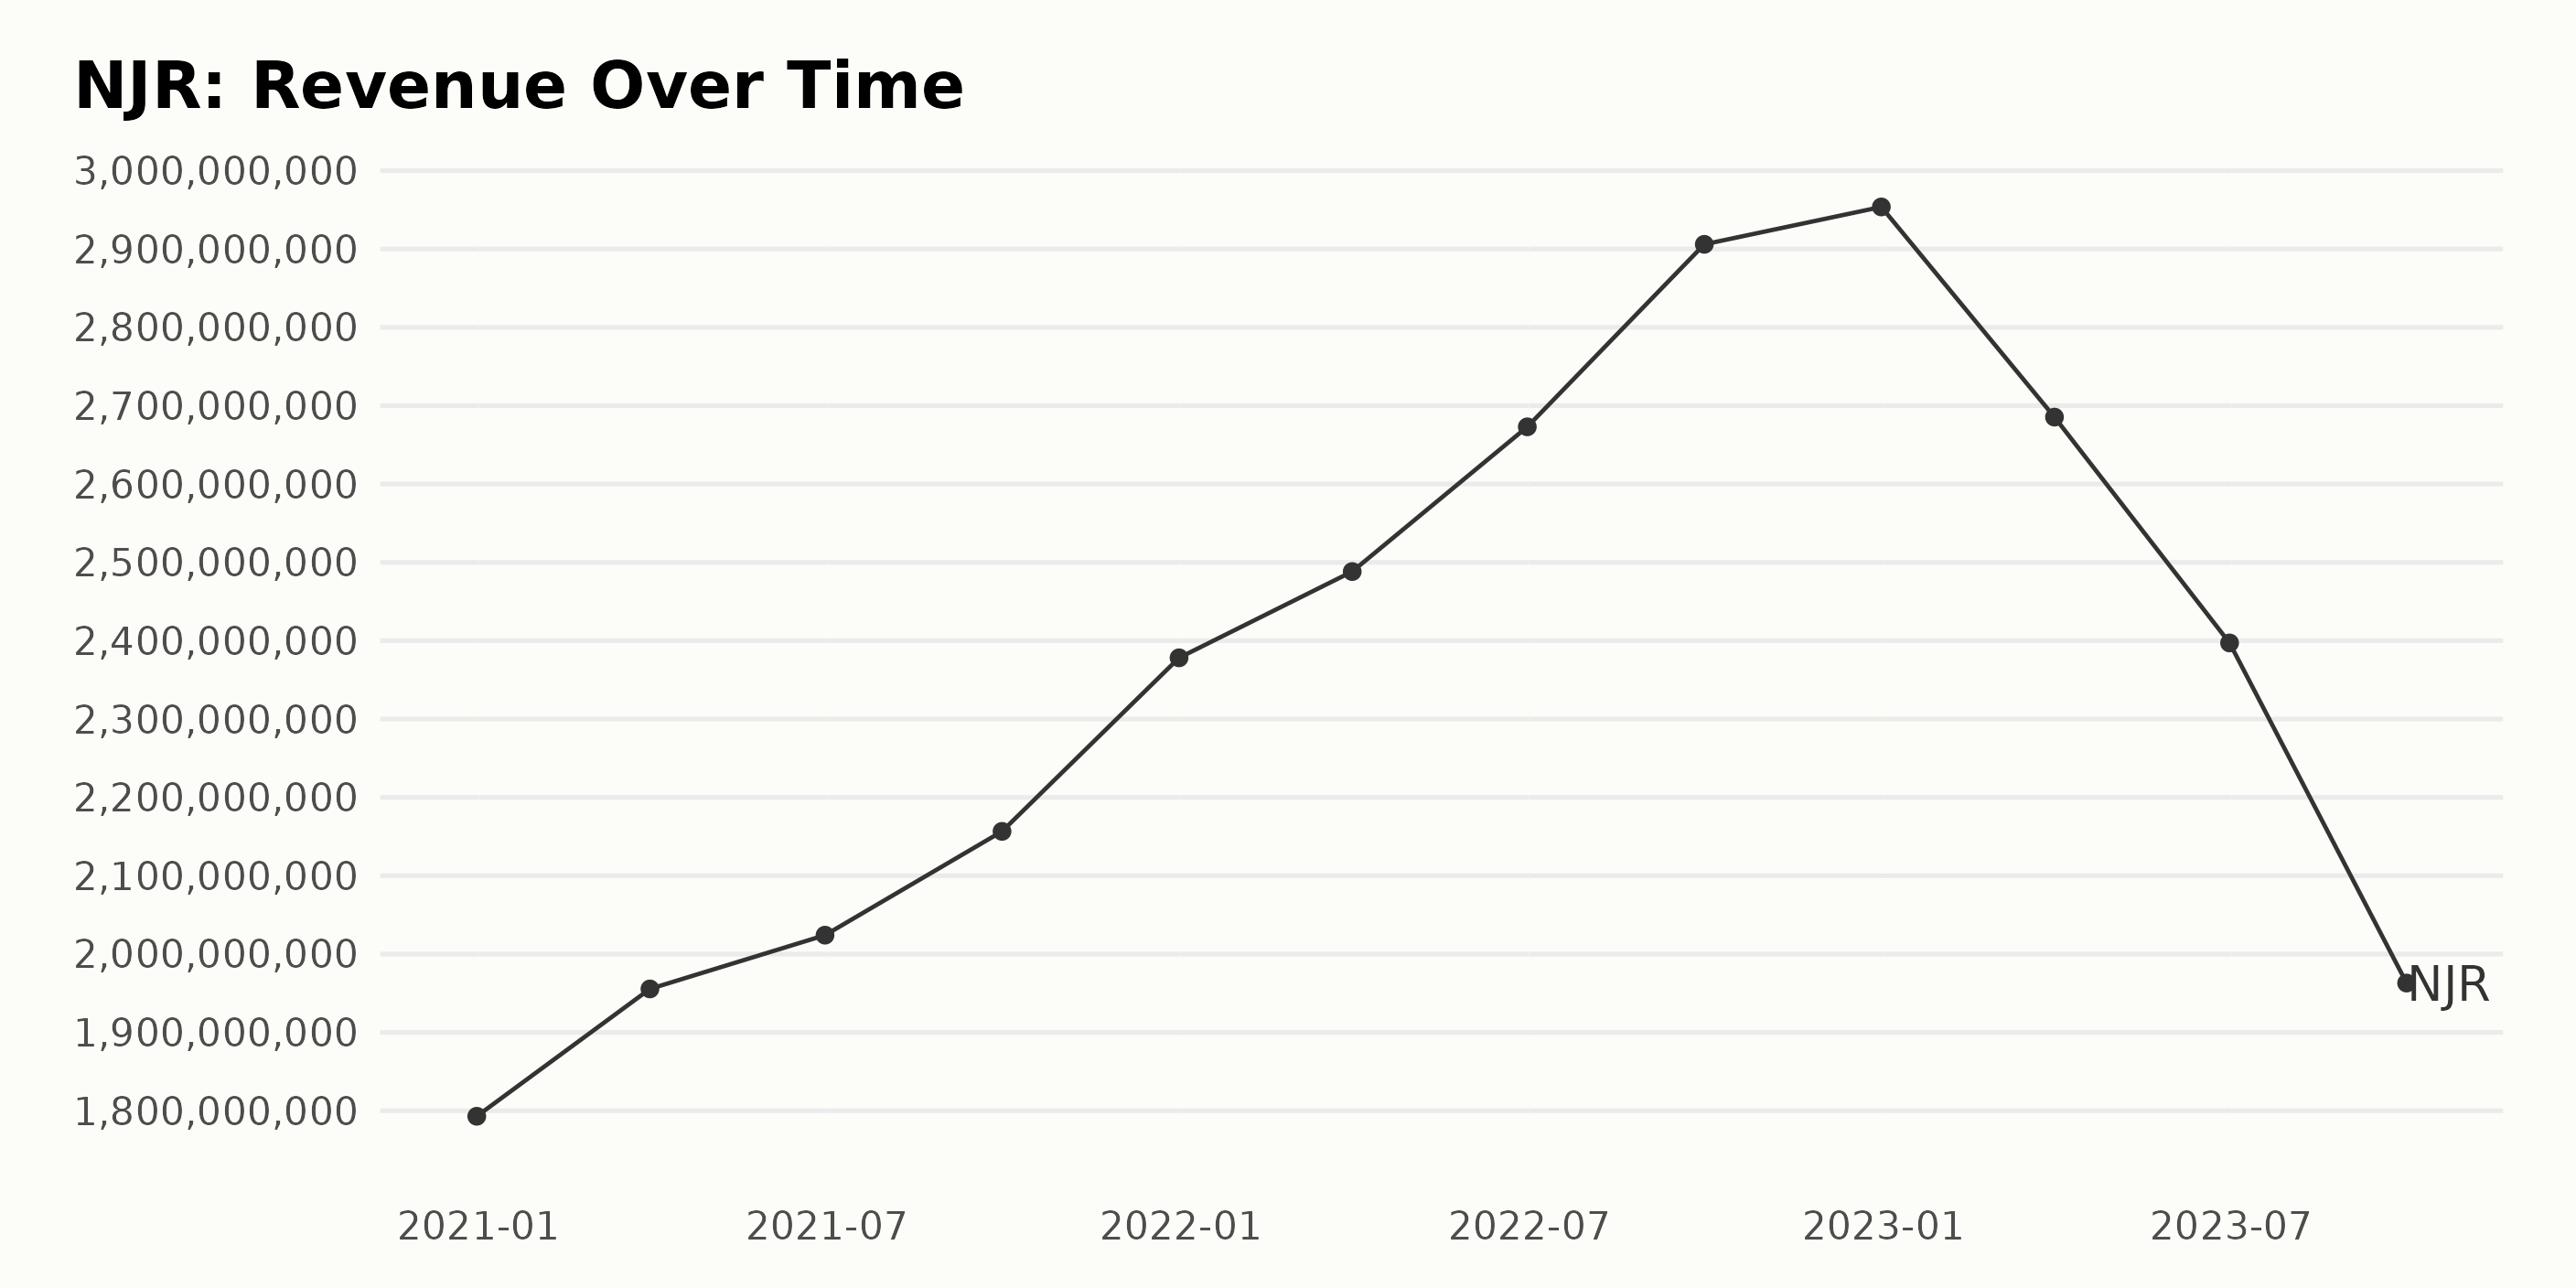
The trend and fluctuations in the trailing-12-month Revenue of NJR have displayed an overall increased growth rate with intermittent variations. The value of NJR's revenue commenced at $1.79 billion in December 2020 and experienced ascending changes until reaching its peak at $2.95 billion in December 2022. Data scrutiny reveals:
- By the end of March 2021, a rise of 9% to $1.96 billion was noted.
- The momentum surged between June 2021 and December 2021, with values varying from $2.02 billion to $2.38 billion.
- Notable growth was observed from March 2022 to December 2022, escalating from $2.49 billion to a peak of $2.95 billion.
- However, the first quarter of 2023 saw a reduction in Revenue to $2.69 billion.
- Remarkably, the rest of 2023 experienced a noteworthy decline, bringing the Revenue down from $2.39 billion in June to $1.96 billion by September.
It indicates that the NJR has been profitable over this period, although the recent downward swing in 2023 must warrant attention.
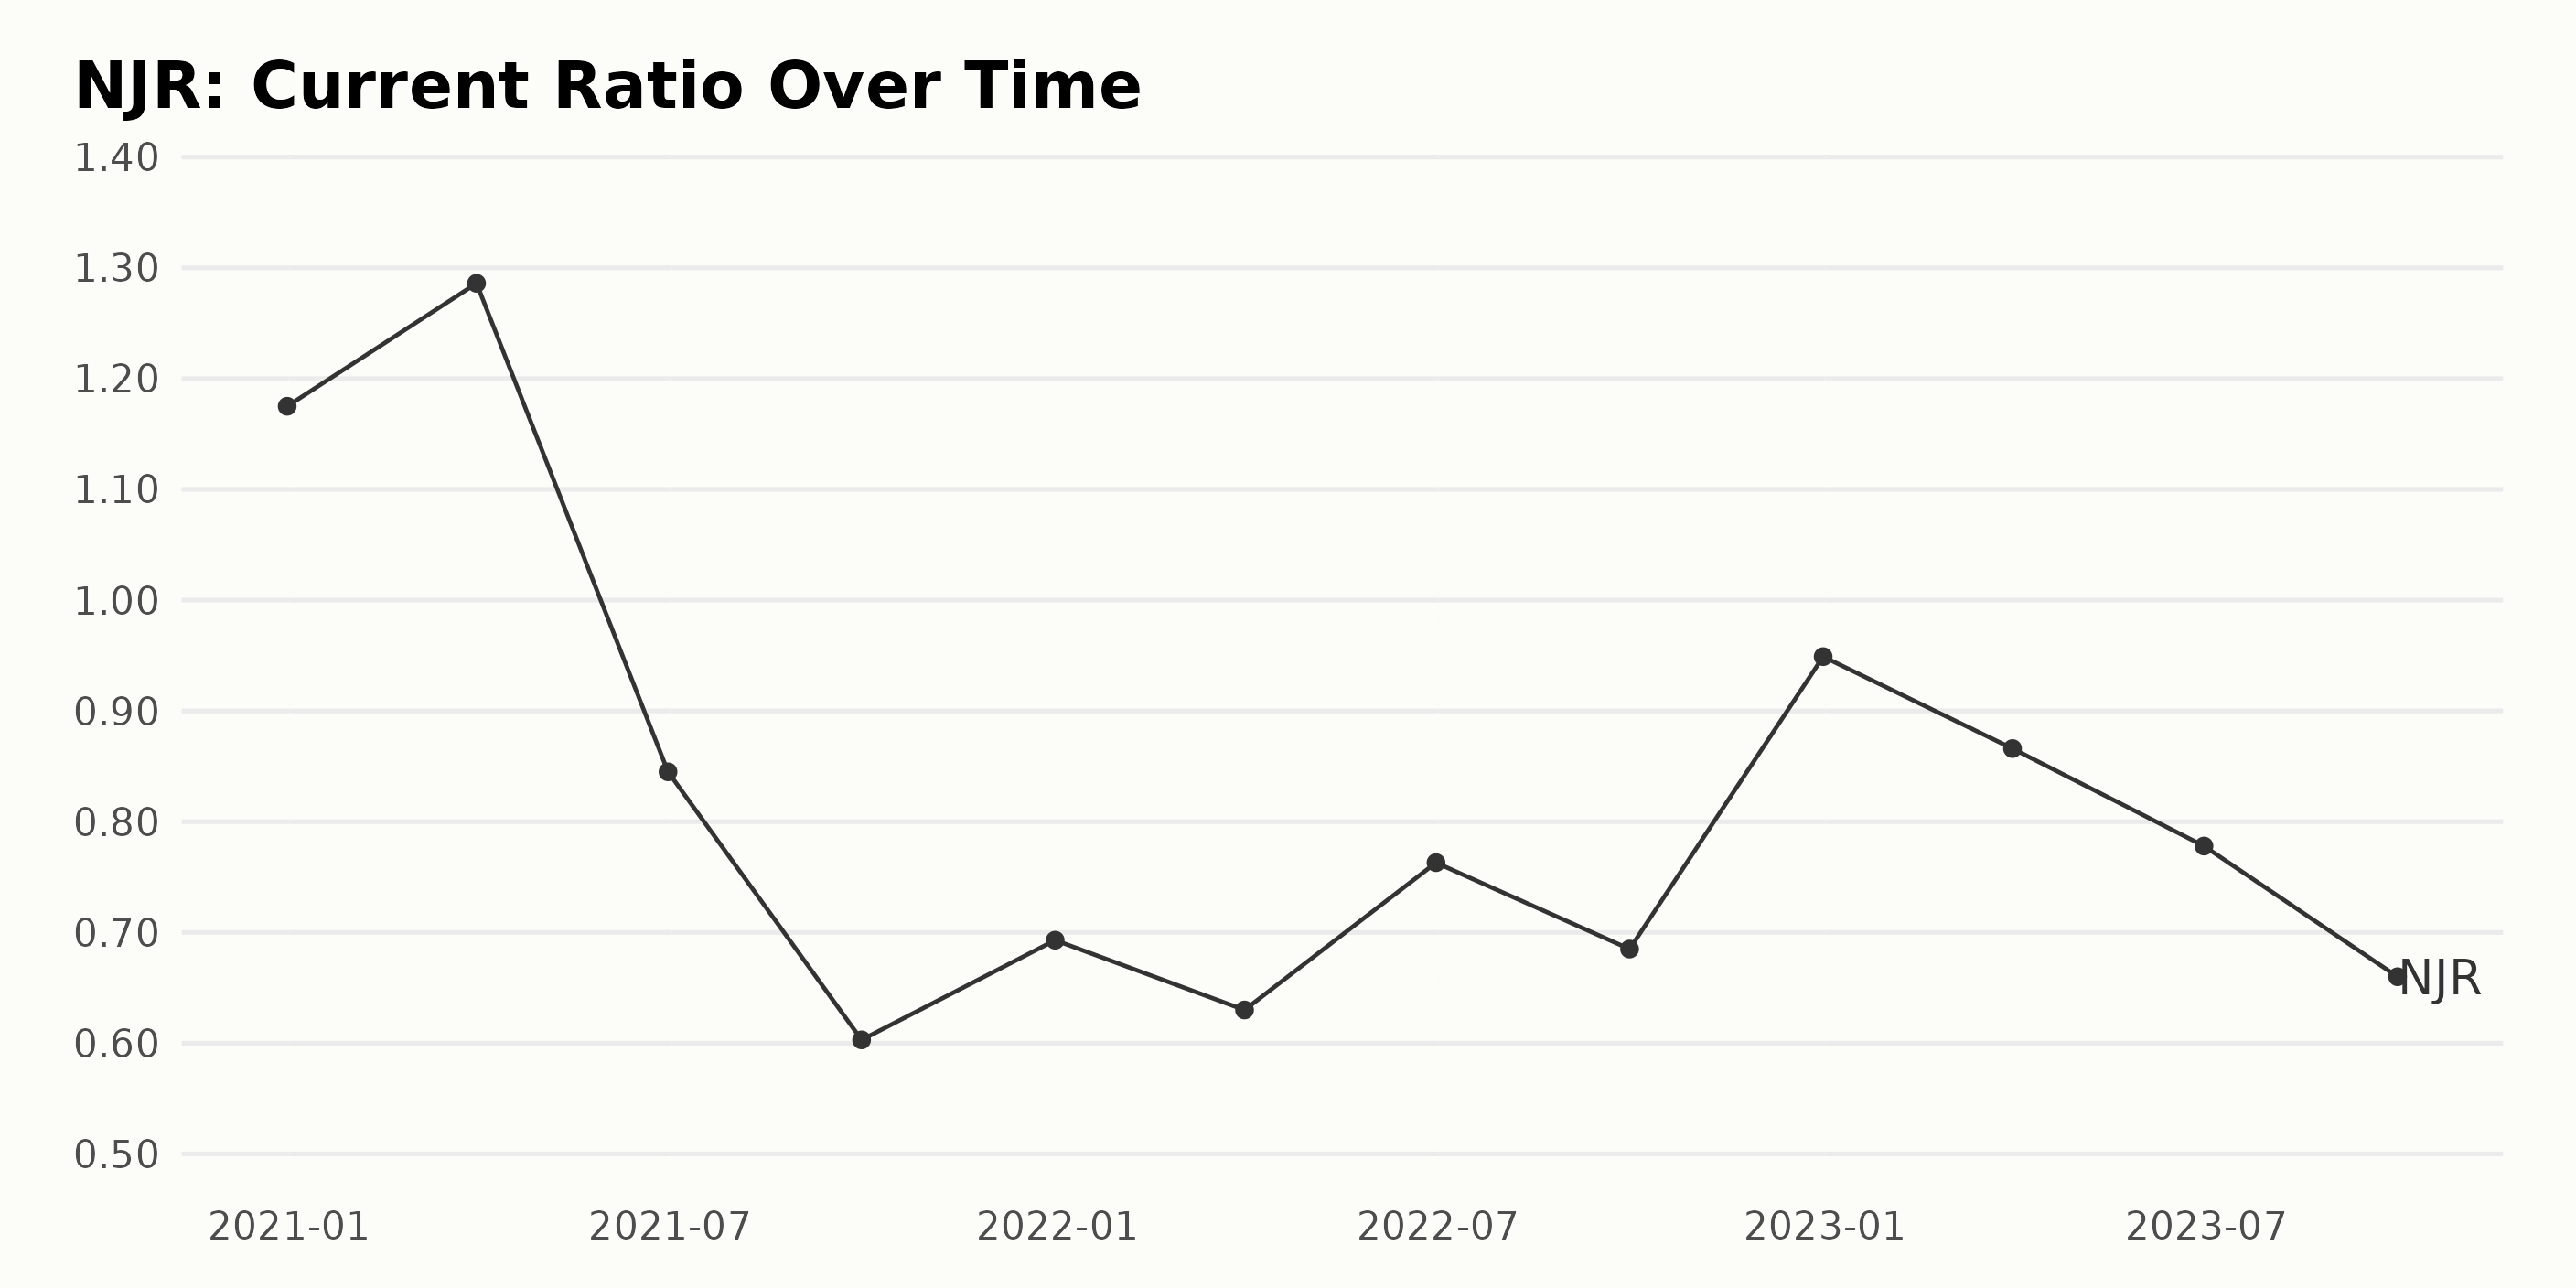
Here's a summary of the trends and fluctuations in the Current Ratio of New Jersey Resources Corporation (NJR):
- From December 2020 to March 2021, there was an increase in the Current Ratio from 1.18 to 1.29, representing positive growth.
- This upward trend was followed by a significant decline in the quarterly periods from March 2021 to September 2021, with the ratio reaching its lowest value of 0.60 in September 2021.
- In the subsequent quarters, NJR experienced a broadly fluctuating but overall slightly upwards trend in Current Ratio from September 2021 to December 2022, peaking at 0.95 in December 2022.
- Post this peak, the Current Ratio experienced a minor drop moving to 0.87 in Mar 2023, thereafter continuing to fall until it hit 0.66 in September 2023. The growth rate calculated measuring the last value (0.66, September 2023) from the first value (1.18, December 2020) is a negative 44% over nearly three years, indicating a general declining trend in NJR's Current Ratio across the given timeline.
It should be noted that while the trends are indispensable in understanding the company's liquidity position over time, the sole dependence on Current Ratio for financial analysis may not provide a comprehensive view of the company's actual health. The most recent Current Ratio, as of September 2023 stands at 0.66. While this is less than the ideal benchmark of 1, suggesting NJR has more current liabilities than assets, other factors need to be taken into account for a complete analysis.
The Asset Turnover of NJR exhibited an upward trend from December 2020 to September 2022 followed by a downward trajectory. Here is a brief elaboration:
- In December 2020, the Asset Turnover was initiated at 0.34.
- A consistent growth pattern transpired all the way through to September 2022. By this point, it had reached a high of 0.48, showcasing a growth rate of approximately 41% over this period.
- However, after peaking in September 2022, the Asset Turnover began to decrease. As of the last value in September 2023, it dropped to 0.31, which stands out as a significant drop of around 35% from its peak in September the preceding year.
Due emphasis has been placed on the most recent data and fluctuations, indicating a suggestive downtrend after the peak in 2022. Future data will need to be closely monitored to understand whether this downward trend will continue or rebound.

Analyzing NewJersey Resources Corporation's Declining Share Prices: A Six-Month Trend Review
Upon analyzing the data from NJR, the following trend and growth rate emerges:
- In June 2023, the share price began at $48.97 on June 2 and saw a marginal rise to $49.83 by June 9. However, it then embarked on a downward trend for the rest of the month, ending at $46.71, as of June 30.
- Going forward into July 2023, the share price gradually dropped from $46.57 on July 7 to $45.60 by July 28.
- This downward trajectory continued into August 2023, with the share price dropping even further from $44.33 at the beginning of the month on August 4 to an end value of $42.53 by September 1.
- In September 2023, the share price fluctuated, starting at $41.73 on September 8 and experienced a slight elevation to $42.96 by September 15, but eventually dropped back down to $41.28 by the end of the month on September 29.
- For October 2023, the shares initially continued their decline, hitting a low of $40.31 by October 6, but experienced a significant recovery to end the month at $42.80 on October 27.
- In November 2023, the share prices maintained a relatively consistent value, rounding out the month at $42.21 on November 22.
On examining the growth rate, a gradual deceleration or decrease over time is noticed. From June to November 2023, the NJR share price has generally been decreasing, indicating an overall negative growth rate during this period. Here is a chart of NJR's price over the past 180 days.

Analyzing Key Trends in Momentum, Value, and Stability for New Jersey Resources Corporation
NJR has an overall D rating, translating to a Sell in our POWR Ratings system. It is ranked #62 out of the 65 stocks in the Utilities - Domestic category.
When evaluating the POWR Ratings for NJR, three dimensions stand out with the most noteworthy scores and trends. These are: Momentum, Value, and Stability.
Momentum
- In May 2023, the Momentum rating of NJR stands at 64.
- This rating increased marginally to 66 in June 2023, before seeing a step decline to 59 in July of the same year.
- There is a downward trend observable in subsequent months, reaching 47 points in August 2023, and an even lower score of 40 in September 2023.
- After hitting a low in September 2023, the Momentum dimension saw an improvement to 53 in October 2023 and further to 57 in November 2023.
Value
- The Value dimension for NJR scored 59 in May 2023, which subsequently increased to 63 in June 2023.
- Despite a minor setback to 61 in August 2023, this score reached a high of 66 in July 2023.
- Post this peak, the value score declined consistently from 66 to 50 between July and October 2023 and again to 48 by November 2023.
Stability
- Stability started at 52 in May 2023, then declined gradually over the subsequent months, reaching 43 in October 2023.
- This downward trend was briefly interrupted as the stability rating rebounded to 45 in both September and November 2023.
These trends reveal that the ratings for NJR have fluctuated over time, signalling varying degrees of Momentum, Value and Stability for the organization over this period.

How does New Jersey Resources Corporation (NJR) Stack Up Against its Peers?
Other stocks in the Utilities - Domestic sector that may be worth considering are Vistra Energy Corp. (VST), Genie Energy Ltd. (GNE), and Brookfield Infrastructure Corp. (BIPC) -- they have better POWR Ratings.
What To Do Next?
Discover 10 widely held stocks that our proprietary model shows have tremendous downside potential. Please make sure none of these “death trap” stocks are lurking in your portfolio:
NJR shares were trading at $42.72 per share on Friday afternoon, up $0.03 (+0.07%). Year-to-date, NJR has declined -11.68%, versus a 20.38% rise in the benchmark S&P 500 index during the same period.
About the Author: Subhasree Kar

Subhasree’s keen interest in financial instruments led her to pursue a career as an investment analyst. After earning a Master’s degree in Economics, she gained knowledge of equity research and portfolio management at Finlatics.
The post Is New Jersey Resources (NJR) Stock a Bargain or a Risk After 14% Decline YTD? appeared first on StockNews.com